Mark Moore


Trackers

Regular readings of the published connection registers, newest first. The TEC Register tracker compares NESO’s weekly Transmission Entry Capacity files; the Embedded Capacity Register tracker is monthly and covers the six distribution network operators. Figures are as published at the time. Where a later edition corrects an earlier one, the correction is in the later edition.

TEC Register

NESO register tracker, edition 5: 21 to 28 September 2026

Posted 30 September 2026

Seven days between files, and the TEC Register barely moved. Two projects joined, one left, net minus 10 MW. Read the full post

Both arrivals are batteries that are already built, Care Wolverhampton BEGA (49.9 MW at Penn GSP) and Care North Tawton BEGA (30 MW at Alverdiscott GSP). The single exit was Melksham Grid Park ESS & PV, 90 MW with a 2037 connection date.

Connection dates are the interesting part. Devol Moor Battery & Solar (400 MW) came forward 25 months to September 2027, and Bryn Tilti (106 MW) came forward 17 months to February 2027. Willington Energy Park (500 MW) went out seven months to October 2028. Taken together that’s +8.3 GW-months, the first week of this series in which dates moved earlier overall. Row and project methods agree, as all three are single-tranche.

On gates, seven projects picked up a Gate 1 label (708.9 MW) and Benthead Solar (63 MW) picked up Gate 2. One label went the other way: Equinor Celtic Sea 2 (1,000 MW) lost its Gate 1 label with nothing else on the row changing. That is currently unexplained.

A method change. From this edition the register level is the sum of every row on NESO’s file, 679.4 GW today. On that basis the levels shown in earlier editions were 3.4 to 4.4 GW low. The weekly movements do not change.

If a gate label can come off the register without a reason attached, how much weight can anyone put on the gate column when sizing the reformed queue?

Independent work, no client and no commercial interest in what the figures show. Whatever they show gets published.

Source: NESO Transmission Entry Capacity Register, files of 21 and 28 September 2026.
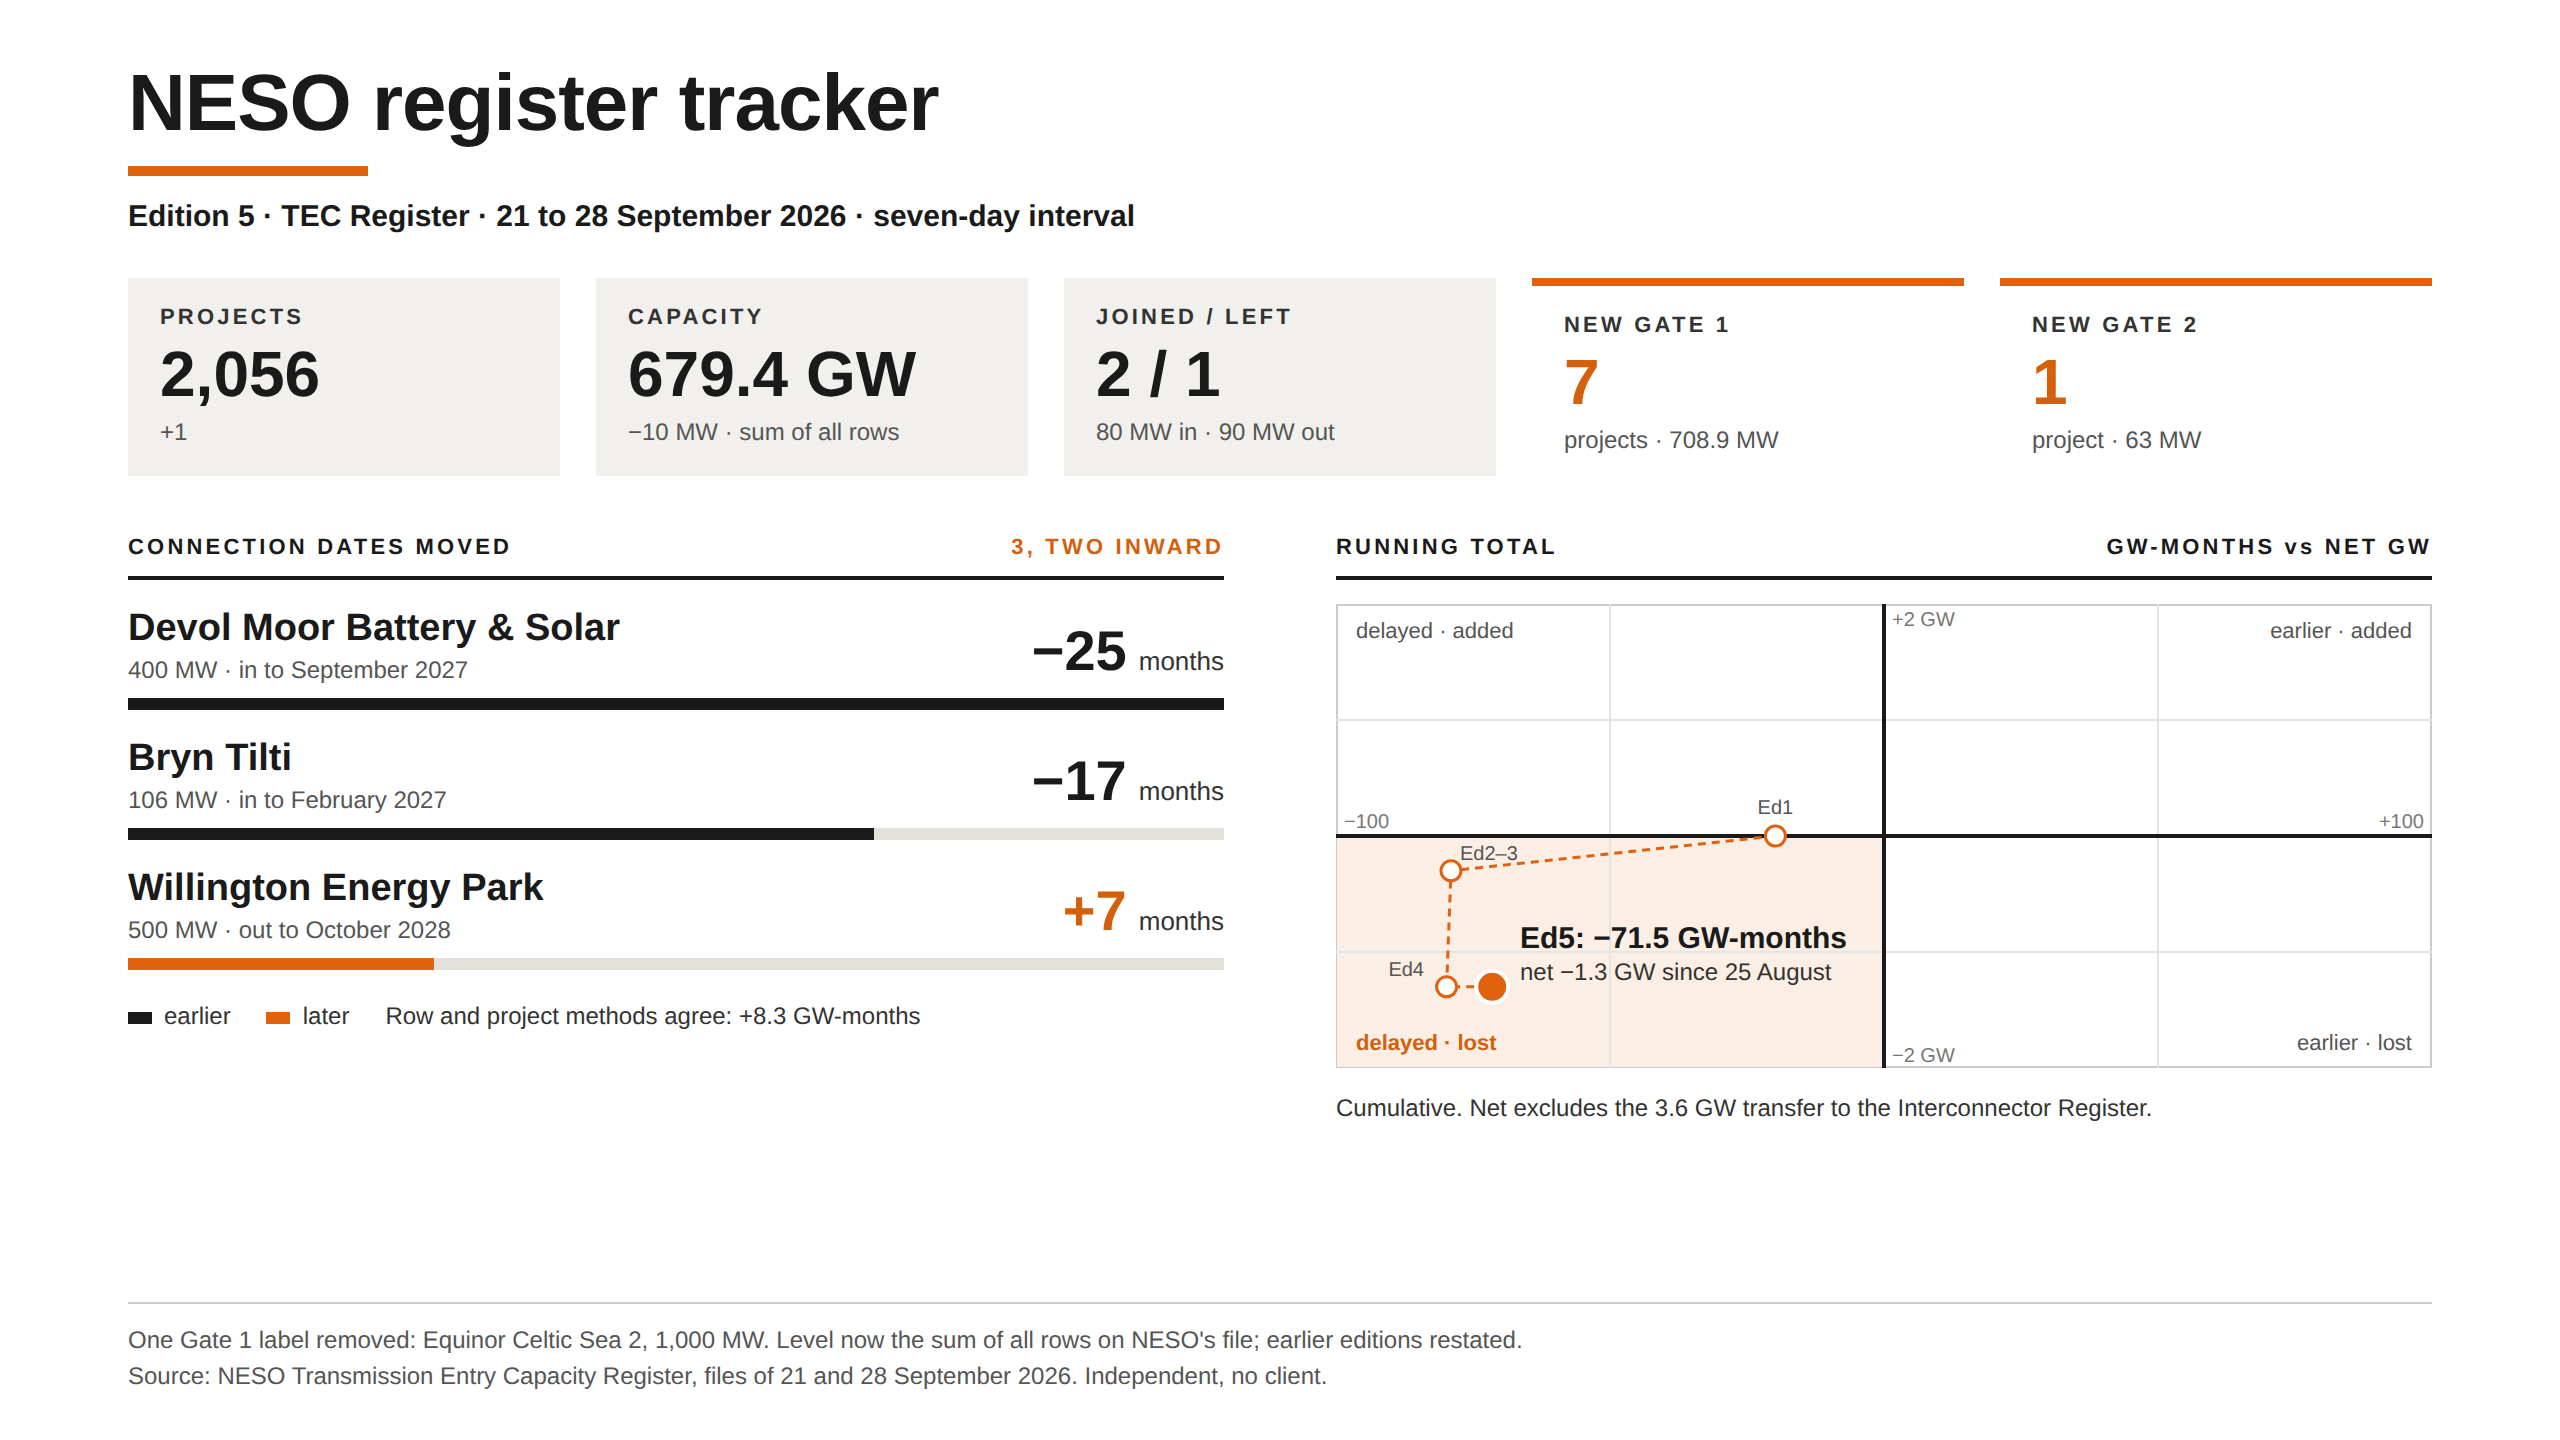
NESO register tracker, Edition 5, TEC Register, 21 to 28 September 2026: 2,056 projects, 679.4 GW capacity, net −10 MW this edition.

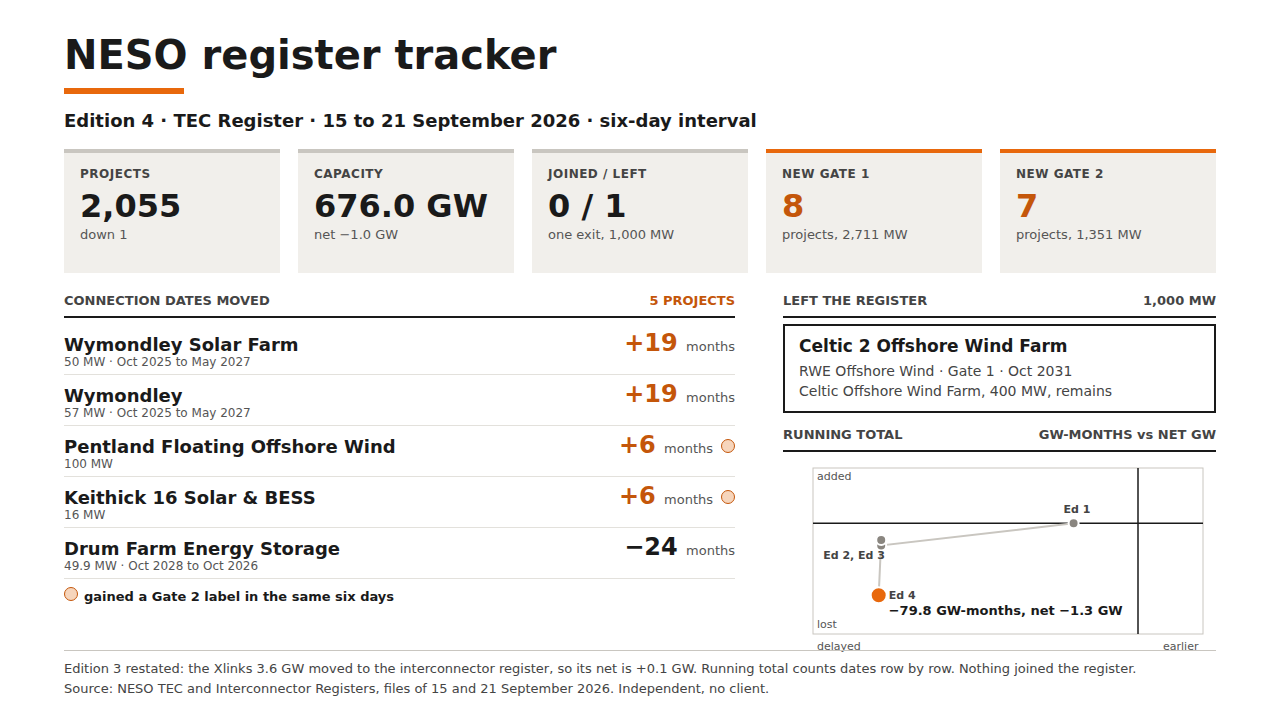
NESO TEC Register tracker: Edition 4

Posted 23 September 2026 · files of 15 and 21 September 2026

NESO published this week’s register on Monday, so this edition compares the 15 and 21 September files, six days rather than seven. Read the full post

First, a correction to last week. Tom Palmer pointed out that the two Xlinks agreements at Alverdiscott had moved to NESO’s interconnector register. They have: both are on the 21 September interconnector file at 1,800 MW each. So Edition 3’s 3.6 GW was a transfer between registers rather than capacity leaving the queue, and that week’s net movement was about plus 0.1 GW. From now on, any interconnector that leaves the TEC Register gets checked against the interconnector register before I count it as gone.

This week one agreement left and nothing joined. Celtic 2 Offshore Wind Farm, registered to RWE Offshore Wind at 1,000 MW with a Gate 1 label and an October 2031 date, isn’t on the 21 September file. Its 400 MW sibling, Celtic Offshore Wind Farm, is still there. Net movement is minus 1.0 GW, leaving 676.0 GW.

Fifteen agreements had a Gate recorded on countersignature, against five last week: seven at Gate 2 carrying 1,351 MW and eight at Gate 1 carrying 2,711 MW. Braintree, at 1,000 MW, was the largest.

Three dates moved by a month or more without a gate change. Two Wymondley agreements, 50 MW and 57 MW, went from October 2025 to May 2027. Drum Farm, a 49.9 MW battery, came forward two years to October 2026.

One move the row-by-row count misses. Willington Green Energy Centre shifted 625 MW of its 1,025 MW from a 2028 tranche to a 2031 tranche without the date on any row changing. From next week I’ll report date movement per project as well as per row.

The Embedded Register, which covers Scotland, held 544 projects and 12.9 GW on 21 September, 38 of them at Gate 2. I don’t have last week’s embedded file, so there’s no weekly comparison this time.

When a connection date moves earlier, as Drum Farm’s did, what would you want to know before believing it?

Independent work, no client, no commercial interest in what the figures show. Source: NESO TEC, Interconnector and Embedded Registers, files of 15 and 21 September 2026.

NESO register tracker, Edition 4, TEC Register, 15 to 21 September 2026: 2,055 projects, 676.0 GW capacity, net -1.0 GW; one exit, Celtic 2 Offshore Wind Farm, 1,000 MW; 8 new Gate 1 and 7 new Gate 2 labels.

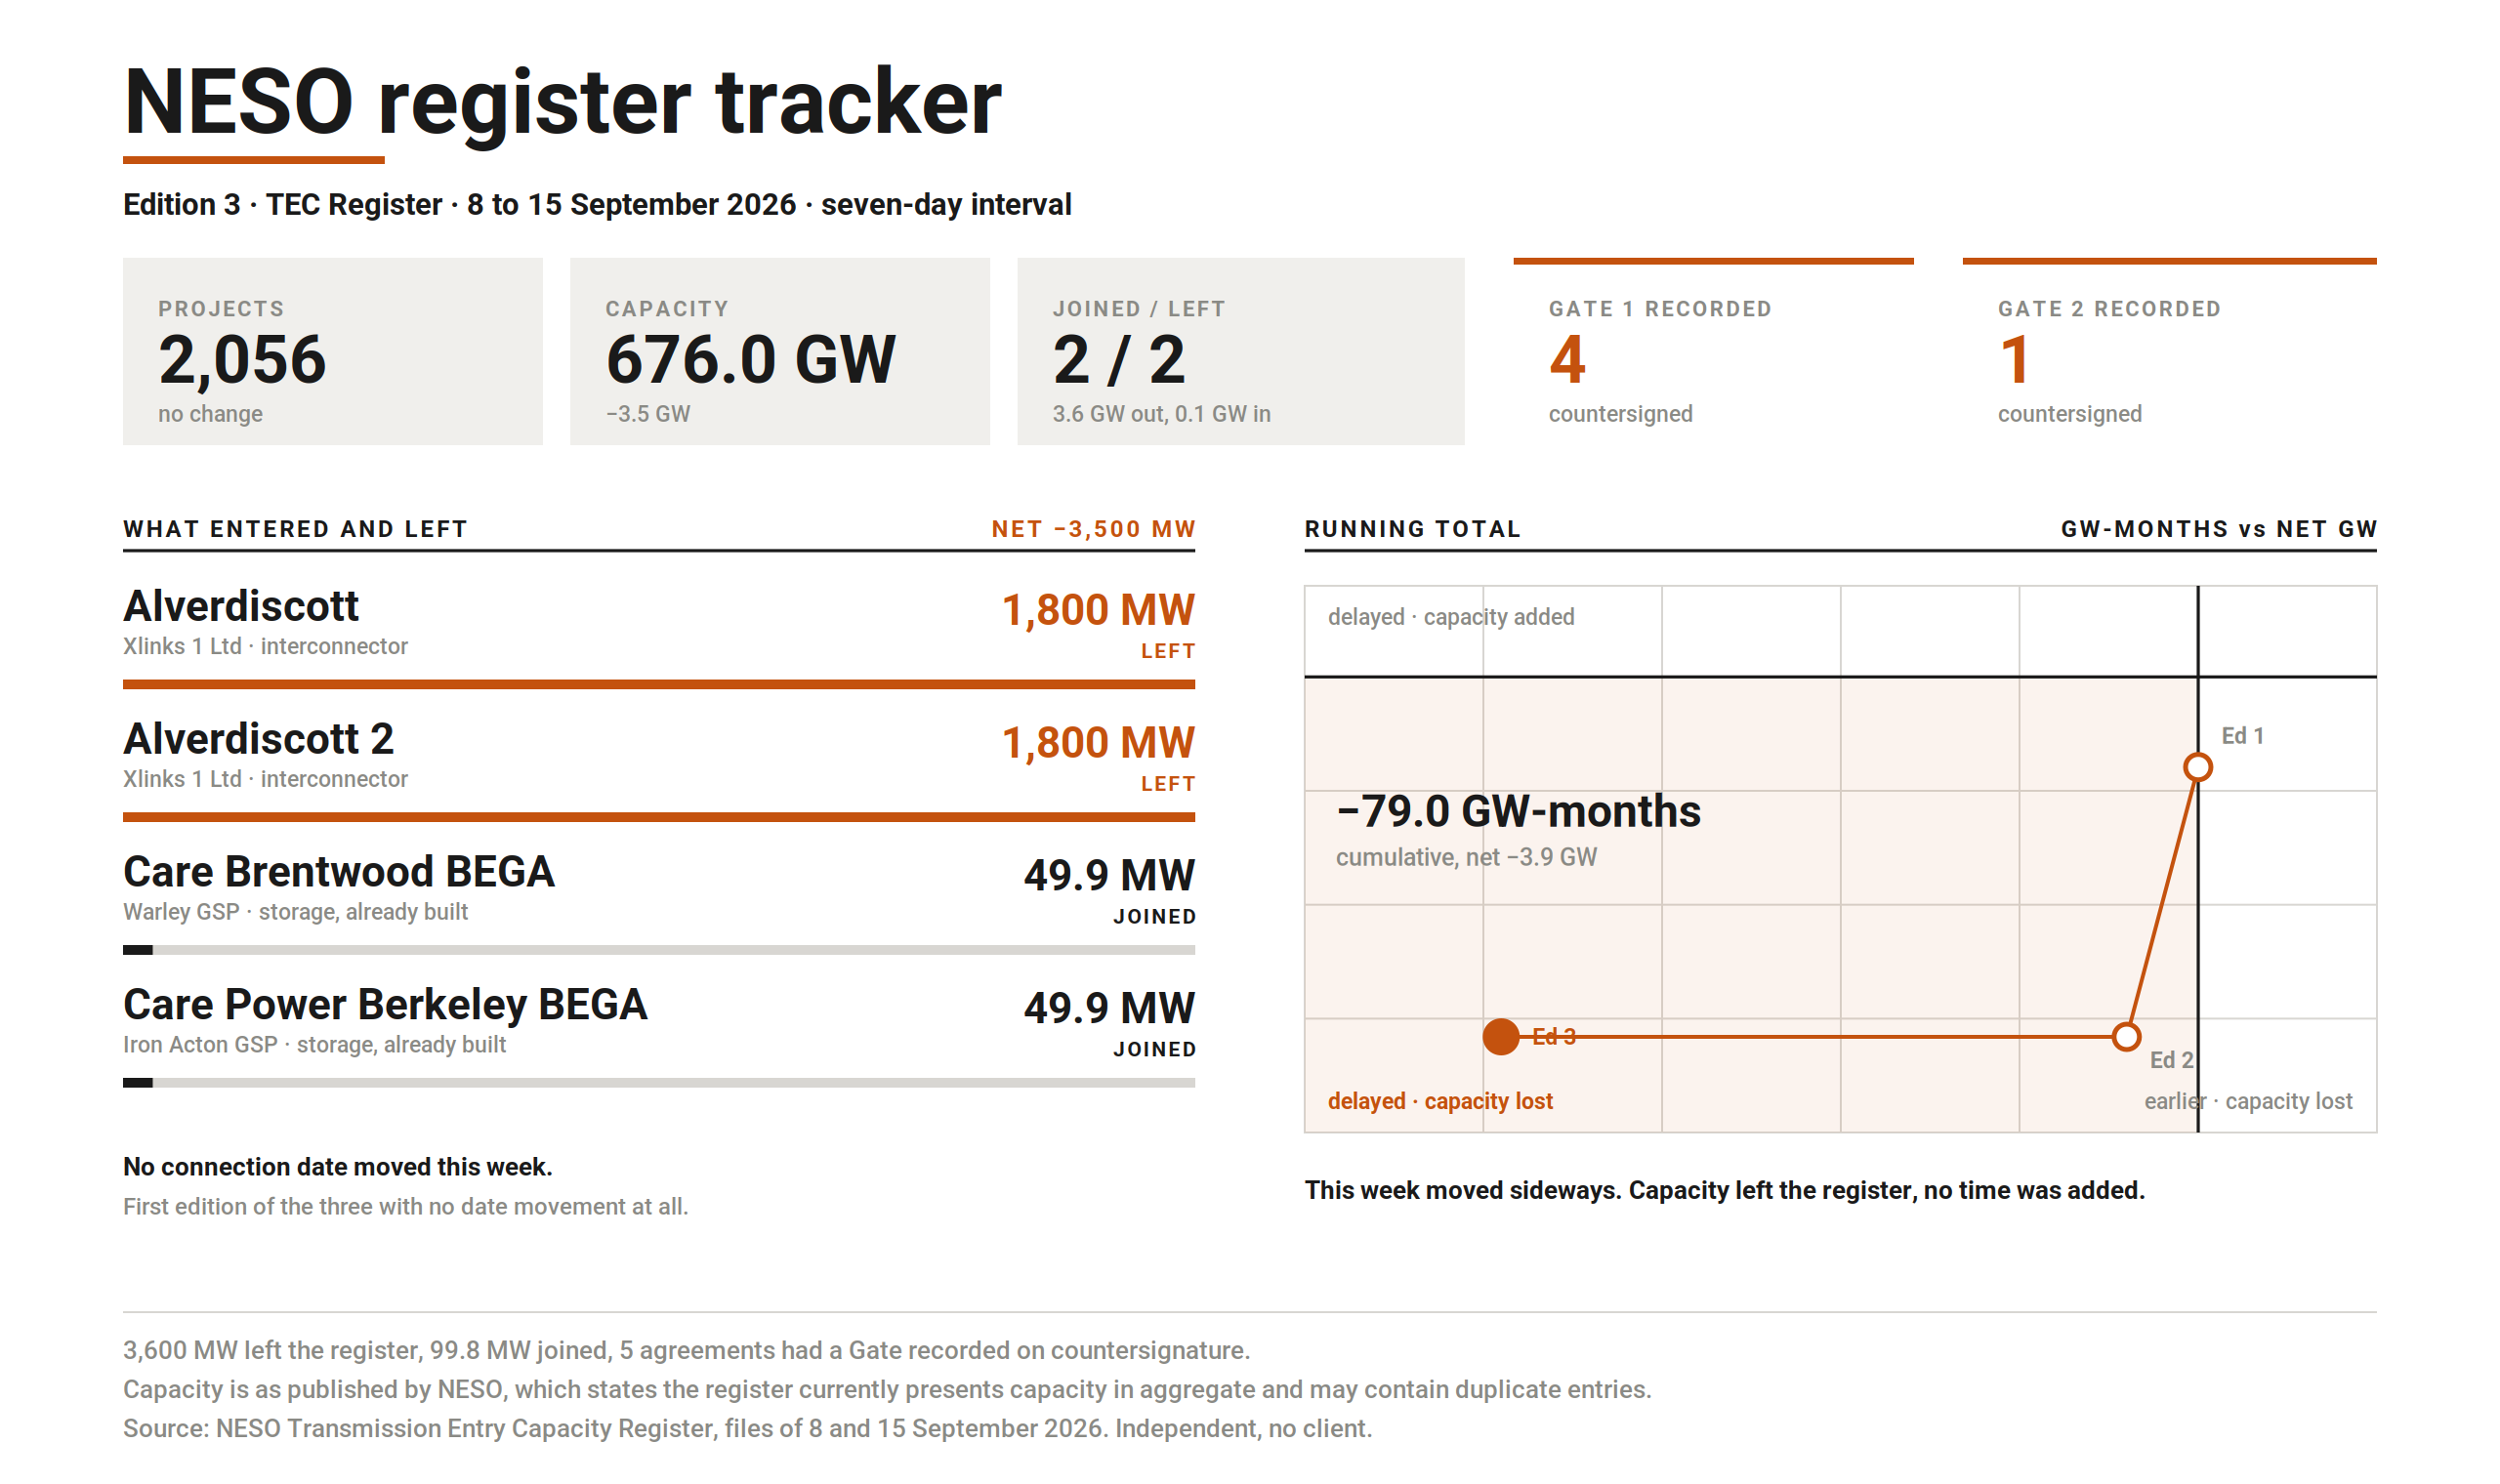
NESO TEC Register tracker: Edition 3

Posted 16 September 2026 · files of 8 and 15 September 2026 · View on LinkedIn

Two connection agreements at Alverdiscott in North Devon came off the TEC Register between the 8 September and 15 September files. Both were held by Xlinks 1 Ltd, both were 1,800 MW interconnectors, and together they were 3.6 GW. Capacity on the register fell from 679.5 GW to 676.0 GW. Read the full post

I can’t tell you what that means, and neither can the register.

NESO’s own note explains why. A temporary data change governance process is running to protect queue integrity while Connections Reform works through, and NESO says some data corrections are taking longer than usual. So a removal might be a termination, a queue management action, or a correction finally landing. From outside, those three look identical.

I had a demonstration of that this week. On the 8 September file, a 212 MW onshore wind farm in Ayrshire appeared split into two rows, one of them labelled as offshore wind. On the 15 September file the split had been reversed and the label corrected. Seven days, no project event, and if I’d diffed 1 September straight to 15 September I’d have seen nothing at all.

The rest of the week was quiet. Two embedded storage sites joined at 49.9 MW each, both already built, so that’s existing capacity becoming visible rather than anything new. Five agreements had a Gate recorded on countersignature, four of them on SP Transmission. Not one connection date moved, which hasn’t happened before in this series.

I’m asking NESO’s open data team whether the Alverdiscott removal was a data correction. I’ll publish what comes back, including a refusal.

If you were underwriting a site on the strength of a connection agreement, what would you need this register to tell you that it currently doesn’t?

Graphic accompanying the post: NESO TEC Register tracker: Edition 3

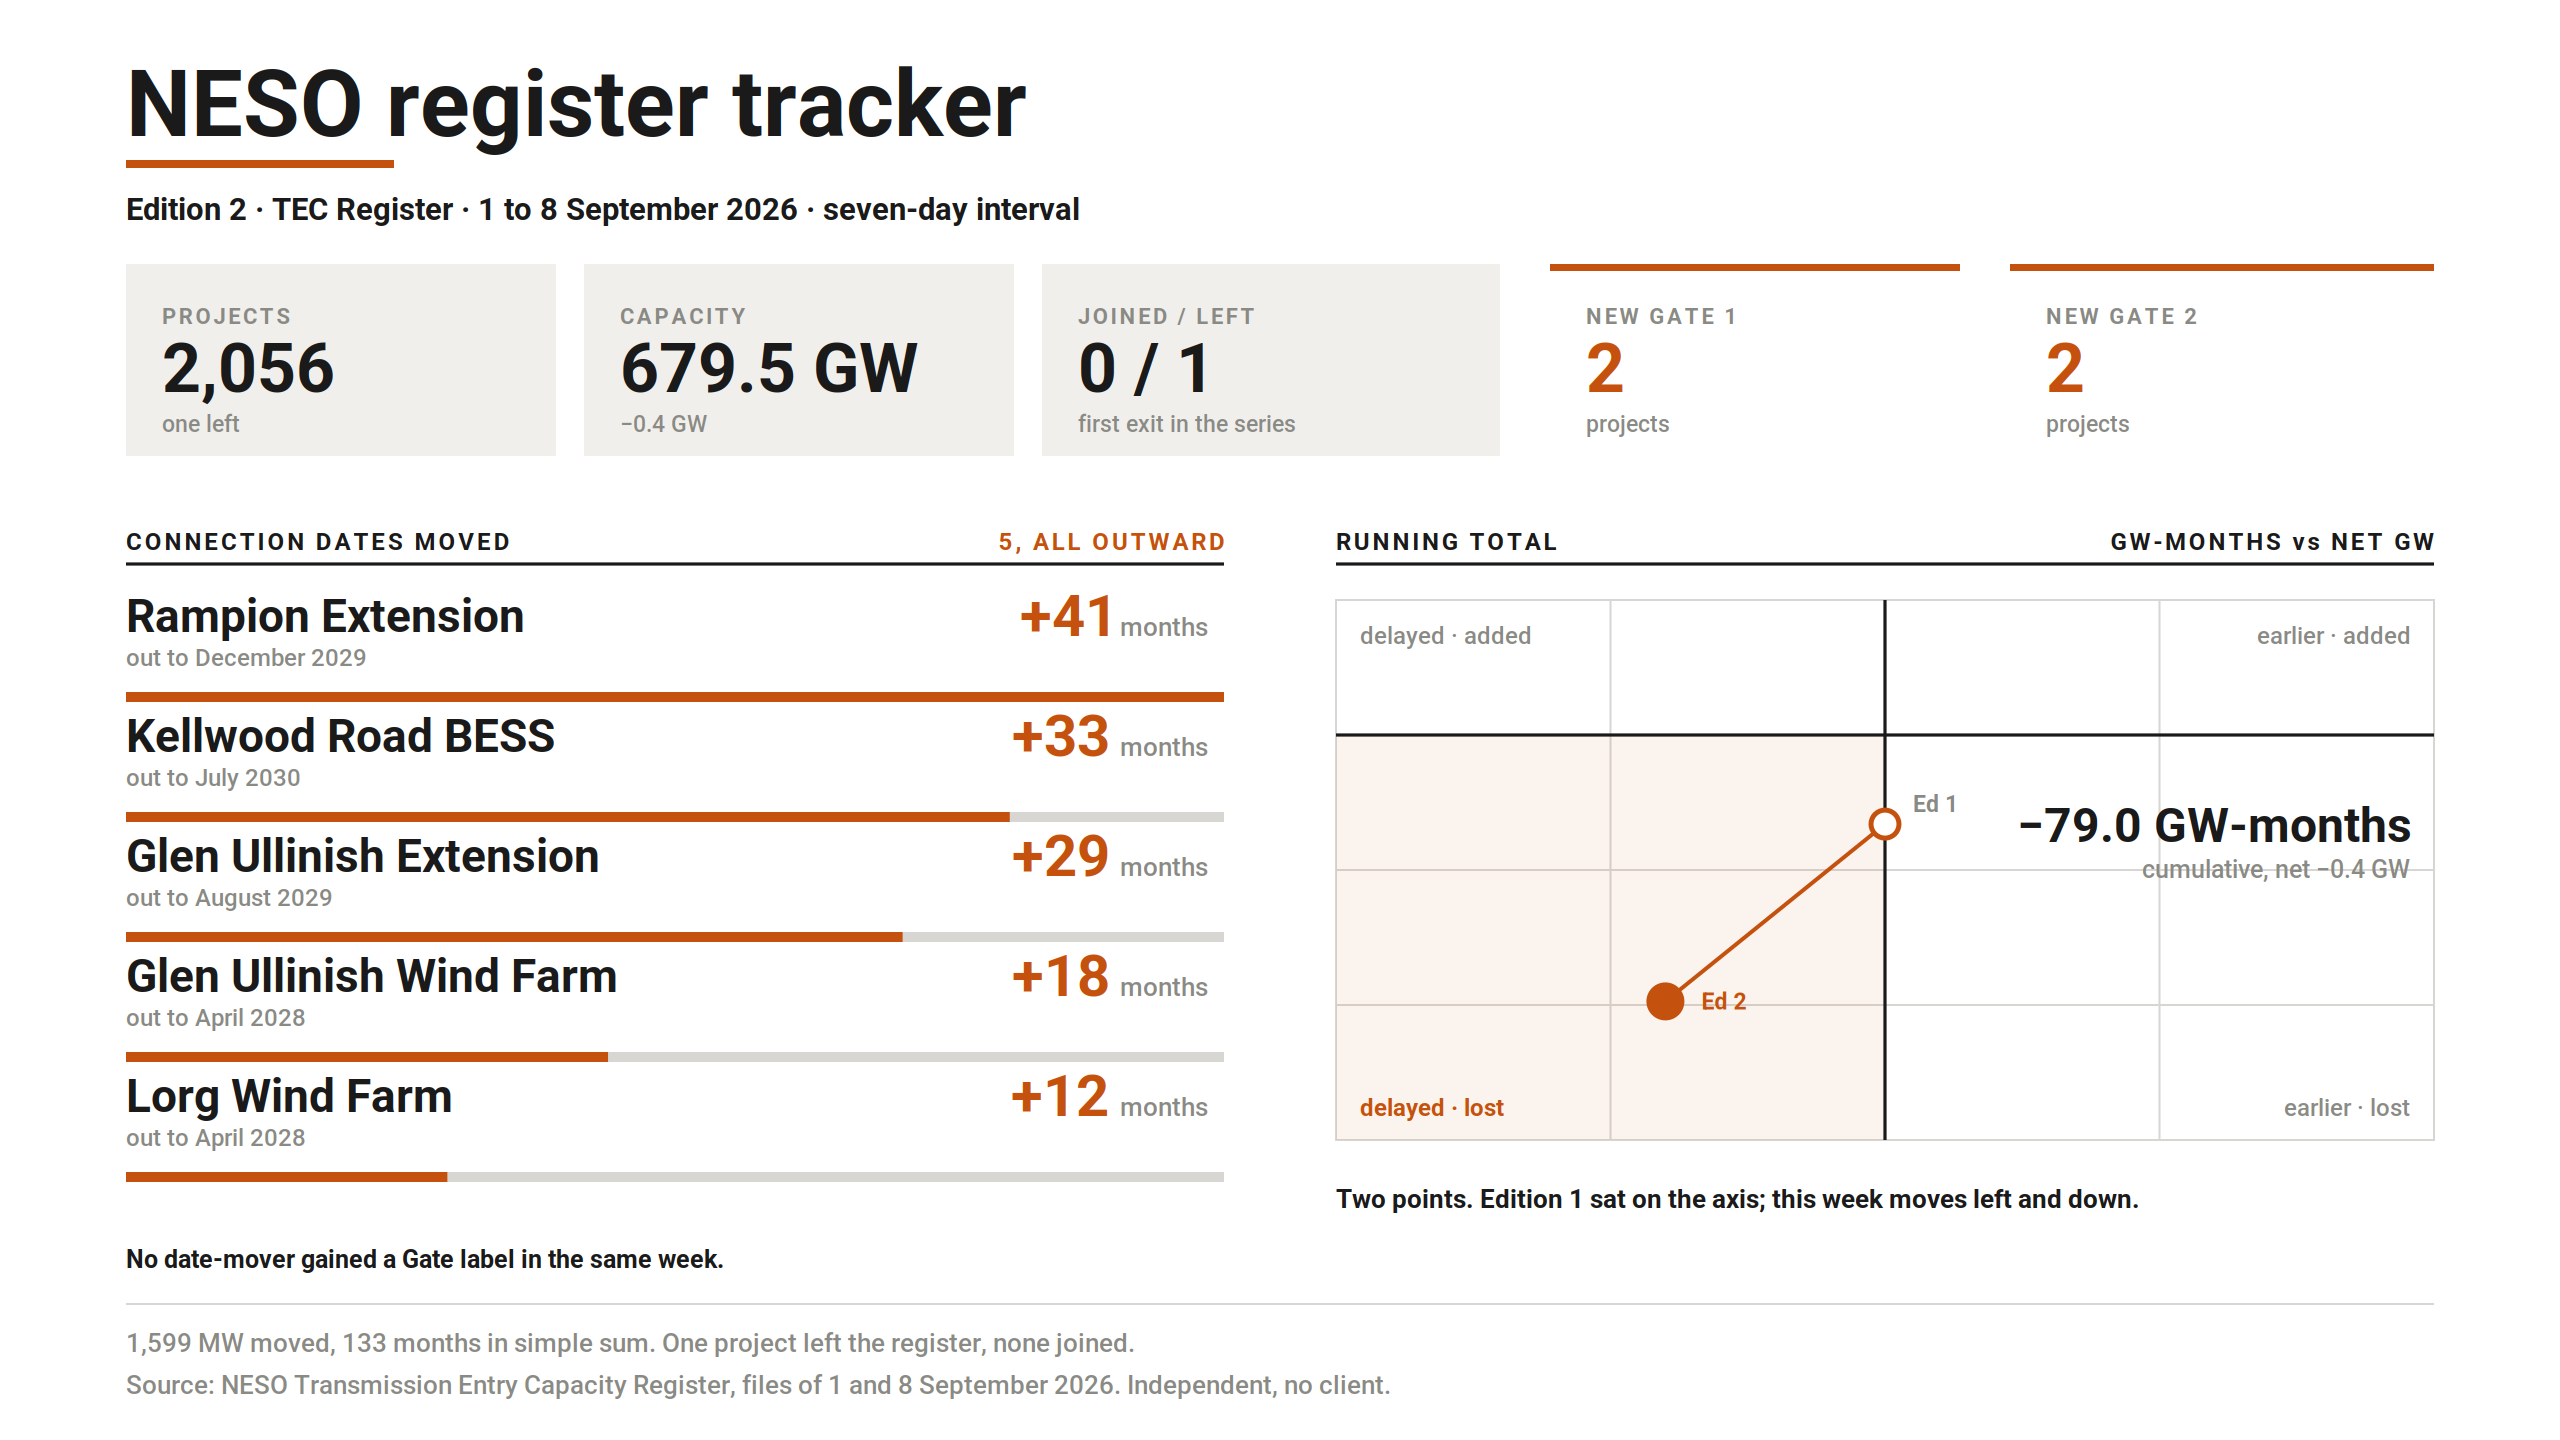
NESO TEC Register tracker: Edition 2

Posted 9 September 2026 · seven days to 8 September 2026 · View on LinkedIn

Quiet week on the register itself. One project left, nothing joined, contracted capacity down 0.4 GW to 679.5 GW across 2,056 projects. Read the full post

The movement was in the dates. Five connection dates changed in the seven days to 8 September, every one of them outward, 1,599 MW between them and 133 months in simple sum.

Rampion Extension carries most of that. It sat at 1 August 2026 until this week, a date that had already come and gone by the time I pulled the previous snapshot, and it now reads 31 December 2029. That is 1,200 MW moving 41 months in a single update.

Four projects gained a Gate label, two at Gate 1 and two at Gate 2. None of them were the ones whose dates moved.

Graphic accompanying the post: NESO TEC Register tracker: Edition 2

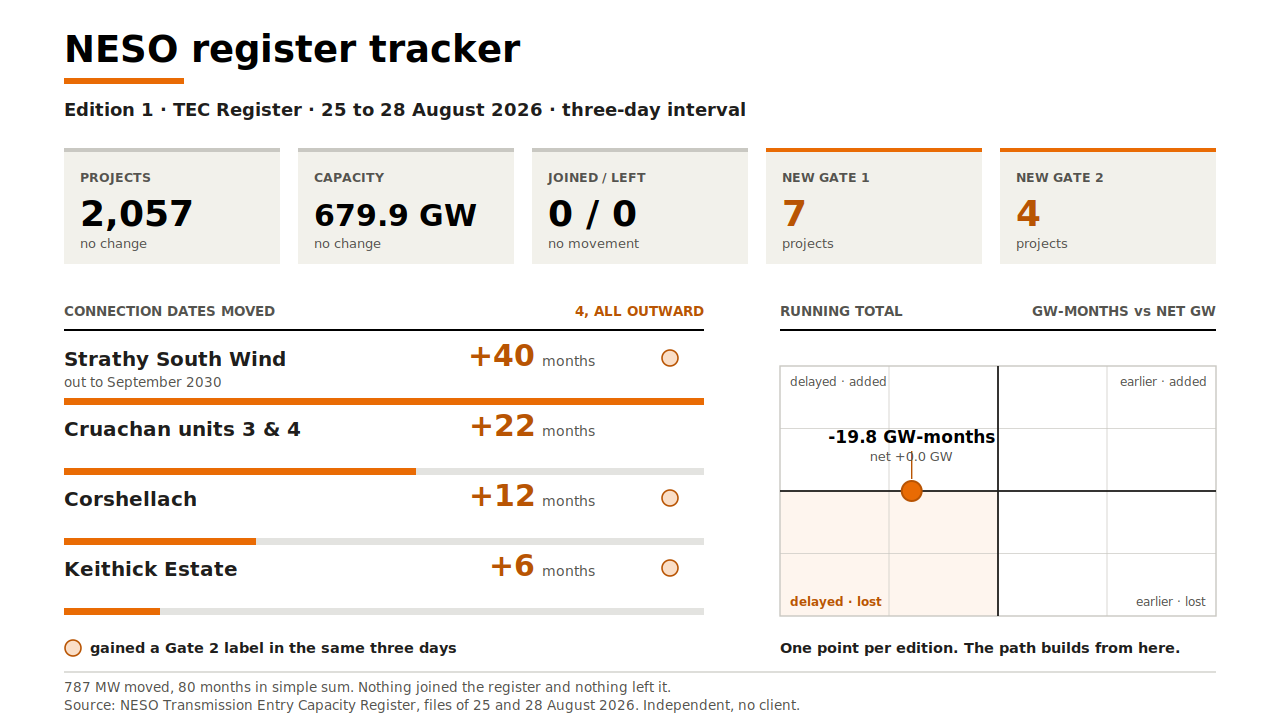
NESO TEC Register tracker: Edition 1

Posted 2 September 2026 · 25 August to 1 September 2026 · View on LinkedIn

The connection registers move every week and almost nobody watches them. I'm going to publish what they do, whatever they show. Read the full post

Edition 1 covers 25 August to 1 September 2026. Seven days. Figures in the graphic.

The bit I didn't expect is the overlap. Five connection dates moved and every one of them moved outward. Four of the five gained a Gate 2 offer carrying a later connection date than the register previously showed. The Gate column populates on countersignature, so what you're seeing is an indicative date being replaced by a contracted one. The contracted date is later.

One week is not a pattern and 1,097 MW is not a lot. But if that's what countersignature looks like, a Gate 2 entry is worth reading differently.

No client, no commercial interest in what the figures show, and whatever they show gets published. Weekly, because the register moves faster than commentary on it does.

NESO register tracker, Edition 1, TEC Register, 25 August to 1 September 2026.

Embedded Capacity Register

Embedded Capacity Register tracker: Edition 1

Posted 22 September 2026 · DNO registers collected 18 September 2026

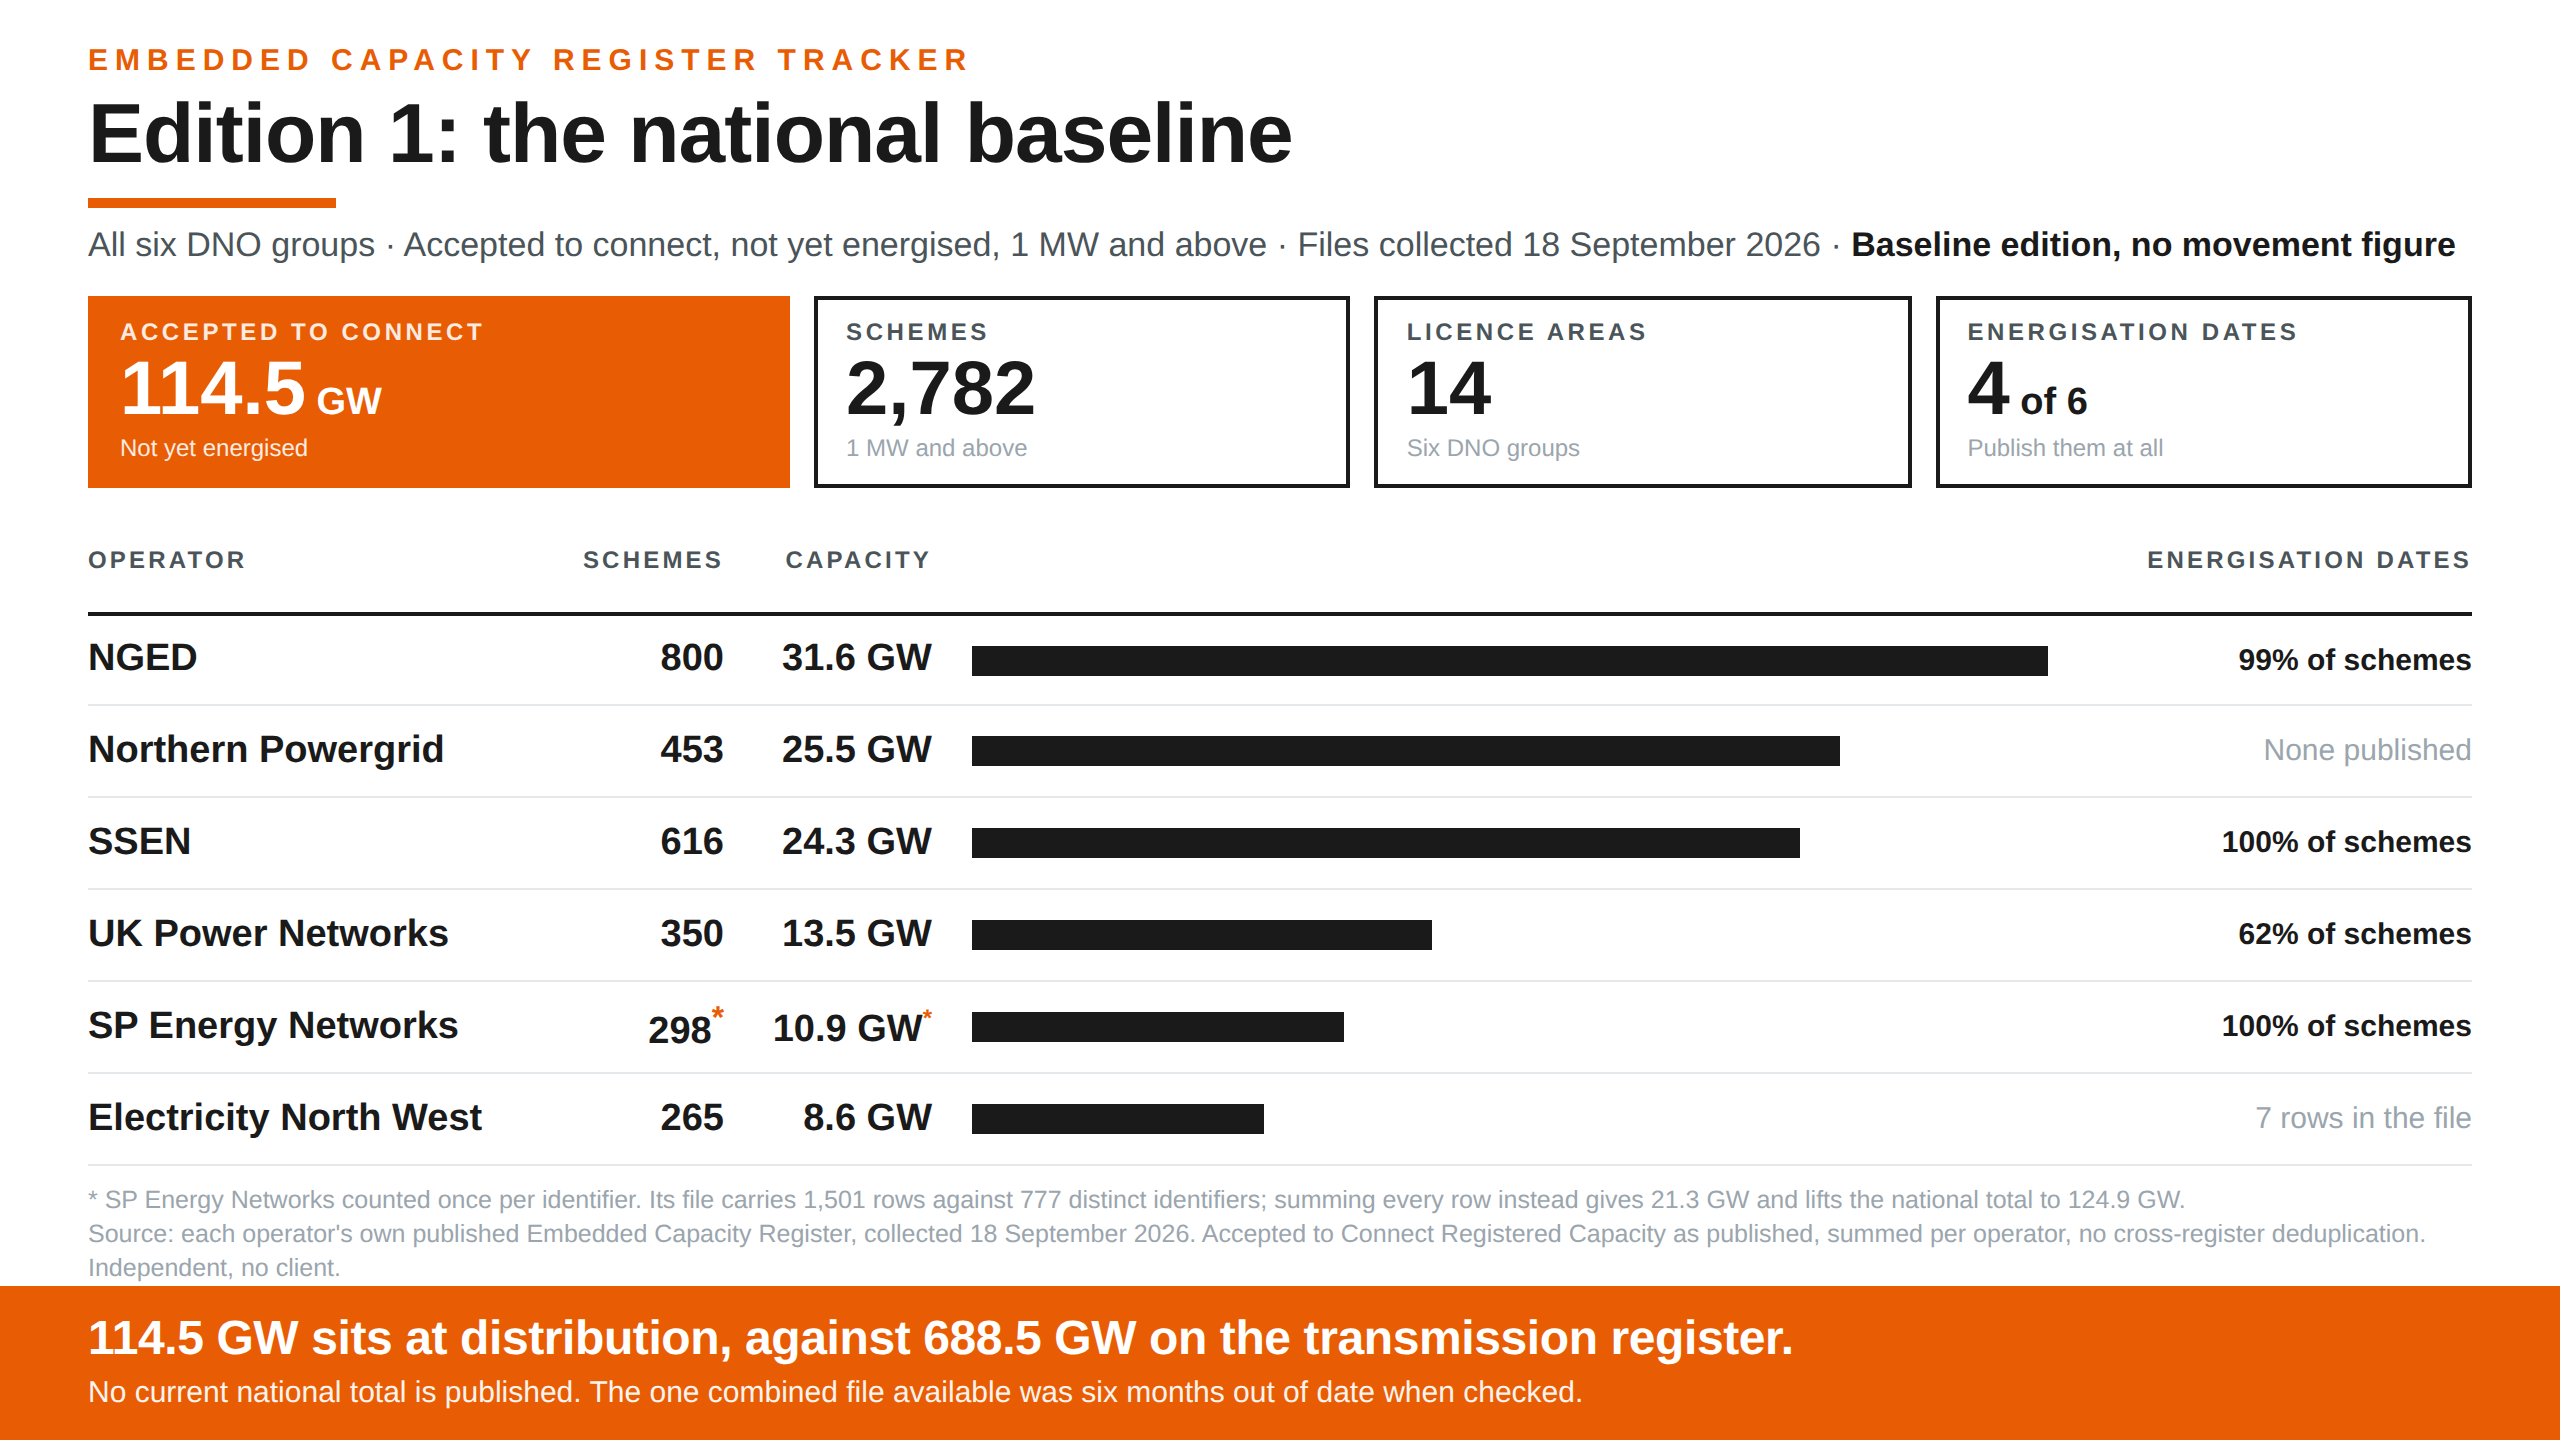
Around 114.5 GW is accepted to connect to Britain’s distribution networks and not yet energised. That’s roughly 2,800 schemes at 1 MW and above, across all six distribution network operators. For scale, the transmission queue on the TEC Register stood at 688.5 GW on the 14 August file. Distribution is running at about a sixth of it. Read the full post

This is edition one of a monthly tracker. It’s a baseline. There’s nothing to measure movement against yet, and edition two in October gives the first comparison.

The counting basis, stated plainly. Accepted to Connect Registered Capacity as published, each operator’s own current file, summed per operator, no cross-register deduplication.

SP Energy Networks needs a note. Its current file runs to 1,501 rows carrying 777 distinct identifiers, with 724 of those appearing twice and the pairs differing from each other on capacity. I’ve read that as one scheme per identifier, which gives 10.9 GW. Summing every row gives 21.3 GW. I haven’t assumed which is intended, so the national figure takes the lower reading. If SPEN reads it differently, I’d be glad to correct it.

Northern Powergrid does publish a combined national file. When I inspected it, the data was six months old and the portal capped retrieval at 10,000 of its 20,075 rows.

So the number exists only if somebody assembles it by hand from six separately formatted files, two of which need an account before they’ll show you anything.

Connections reform is run to targets and reported against transmission. If a sixth of the queue sits at distribution with no current published national total, what is the reform being measured against?

Provenance: Primary. Computed from the six DNO groups’ own published Embedded Capacity Registers, collected 18 September 2026. TEC comparator from the NESO Transmission Entry Capacity Register, file of 14 August 2026. Independent, no client.

Graphic accompanying the post: Embedded Capacity Register tracker: Edition 1