Mark Moore


Articles

Why does CMP470 make sense?

Published 28 September 2026 · Read the post

Ofgem’s minded-to consultation on CMP470 closes on Thursday 1 October. It proposes an Oversubscribed Technologies Commitment Fee, a charge on battery storage projects for holding a queue position in a technology the system already has too much of. I’ve submitted a response supporting it. This piece sets out why, and what I’ve suggested alongside it. Read the full piece

The problem in two numbers

Around 90 GW of battery storage is either operating or holds Gate 2 status: roughly 7 GW of the first and 83 GW of the second. Estimated need by 2035 is around 29 GW. Some surplus is useful, because projects drop out and others need to be ready to replace them. Three times the requirement is well past that point, and network companies still have to plan for all of it.

Holding a place has cost very little. Ofgem’s impact assessment shows that 26% of the battery capacity at Gate 2 or already energised has posted no securities or liabilities at all. Counted by project, half have posted less than £800/MW in securities. Projects commissioning in 2027, where Ofgem presumes the full user commitment regime already applies, have posted £5,600/MW on average. At the low end, a queue position is close to free.

Why the fee works

The fee starts at £3,000/MW. If the oversubscription doesn’t fall, it rises to £5,000/MW after six months and then by £5,000/MW every six months to a ceiling of £25,000/MW. None of that bites straight away: the fee first appears in the July 2027 securities statement and is payable from October 2027.

Ofgem puts the ceiling at more than 25% of build cost for a short-duration battery and more than 7% for a four-hour one. The £3,000/MW start is 12% of the ceiling, which on the same basis works out at roughly 3% and under 1%. A developer who intends to build can carry that. One holding a position as an option has a reason to think again, and plenty of notice to do it.

That’s the job a commitment fee does. Ofgem has no direct read on whether a developer means to build, so the fee asks for money and lets the answer sort the queue.

Seeing who holds the queue

The impact assessment looks at the response to the fee mainly as a choice between staying and leaving. There’s a third option, which is to sell.

A developer that would rather not fund a rising security can sell the project company to someone better placed to. The capacity stays in the queue and the new owner posts the fee. Ofgem has seen the pressure coming. Stakeholders told it that stronger fees fall hardest on smaller, less well-capitalised developers, and the impact assessment accepts that a liquidity requirement may favour larger balance sheets. What neither document goes on to consider is a change of ownership.

Ofgem prices the interest cost of the fee at a single real rate of 4.08%, taken from BBB-rated utility bonds, and applies it to every developer. The index behind that rate only admits bonds rated BBB- or better. A smaller developer without an investment-grade rating is likely to borrow above it, so its cost may be somewhat higher than the headline figure suggests.

Changes of ownership are already hard to see, whatever the reason for them. In July 2026 Alpiq bought 90% of Harmony Energy, with co-founder Peter Kavanagh keeping 10% and staying on as chief executive; brand, team and operating model all carried over. On 9 July, as the deal completed, Companies House stopped naming anyone as controlling the company. Kavanagh’s 10% sits below the reporting threshold, and the company filed a statement that it has no registrable person or registrable legal entity. The TEC Register lists project companies and carries no ownership field, so nothing on it records the change. There’s nothing to suggest the sale had anything to do with the fee, which isn’t active yet. It’s simply an example of how little a change of control shows up.

Exits can be just as hard to read. Between the register snapshots of 14 and 25 August 2026, seven projects totalling 4.2 GW left the TEC Register. All seven sit in companies of one joint venture between Elmya Energy and Renewable Power Capital. At Companies House, the seven and a related development company were all reorganised on the same day, 31 March 2026, with identical changes of registered office, directors and company secretary. Nothing was filed around the August exit, and the companies remain active. Anyone reading the register line by line would log seven separate exits; it takes the company names, and a look at Companies House, to see a single owner’s decision behind them.

Gate 2 status is also now a deal term. In May, Gresham House agreed to buy a 480 MW battery project near Rayleigh, conditional on the project receiving a favourable Gate 2 offer.

None of this counts against the fee. If a project passes to an owner who can post the security and build it, the queue is better used for it. Ofgem concludes that competition effects are likely to be limited, and that may well prove right. Ownership data would allow it to be tested, and would show changes in the structure of the battery pipeline that the register on its own can’t.

The data centre door

The impact assessment notes that some battery projects are trying to modify their Gate 2 offers to connect as data centres instead, citing up to 9 GW. Demand is outside the fee, so conversion looks like a way out. NESO’s guidance closes most of it. A full change from battery storage to a data centre is treated with a later queue position, because a data centre imports at close to full load for far more hours. Converting costs the place in the queue.

Two things are still unclear: what happens to fee already posted when a project converts, and how a converting project sits against the separate commitment fee proposed for data centres under Curate. I’ve asked Ofgem to confirm both.

What would help

I’ve suggested two things, both modest. NESO could collect the ultimate controlling party of each fee-liable project when securities statements are issued, starting with the first one in July 2027. It needn’t be published project by project. An aggregate figure, such as the share of liable capacity held by the largest owners, would do. Then a review after the first two escalations, comparing ownership at activation with ownership at review and setting exits against sales.

With that data in hand, Ofgem could track who ends up holding the queue once the fee starts to bite.

If the fee works and the queue shrinks, how would anyone know whether the capacity that remains is held by more owners or fewer?

Sources

Ofgem, CMP470 minded-to consultation, September 2026 (paras 2.5, 3.18, 3.23, 3.24, 5.13, 5.14)

Ofgem, CMP470 Initial Impact Assessment, 17 September 2026 (paras 1.2, 2.15 and fn 15, 2.16, 2.17, 4.16, 4.17 and fn 25, 4.19; Figures 2 and 3)

FTSE Russell, FTSE UK Broad Investment-Grade Bond Index (UKBIG) factsheet, as cited by Ofgem in IIA fn 25

NESO, Guidance on Material Technology Changes (section 4.1)

Fasken, Harmony Energy completes sale of a majority stake to Alpiq, July 2026

Companies House, Harmony Energy Limited (10141078), persons with significant control

Companies House, RPC Elmya Carnation company filings

NESO TEC Register, snapshots of 14 and 25 August 2026

Energy-Storage.news, UK BESS M&A rebounds, 9 June 2026 (Gresham House, Rayleigh)
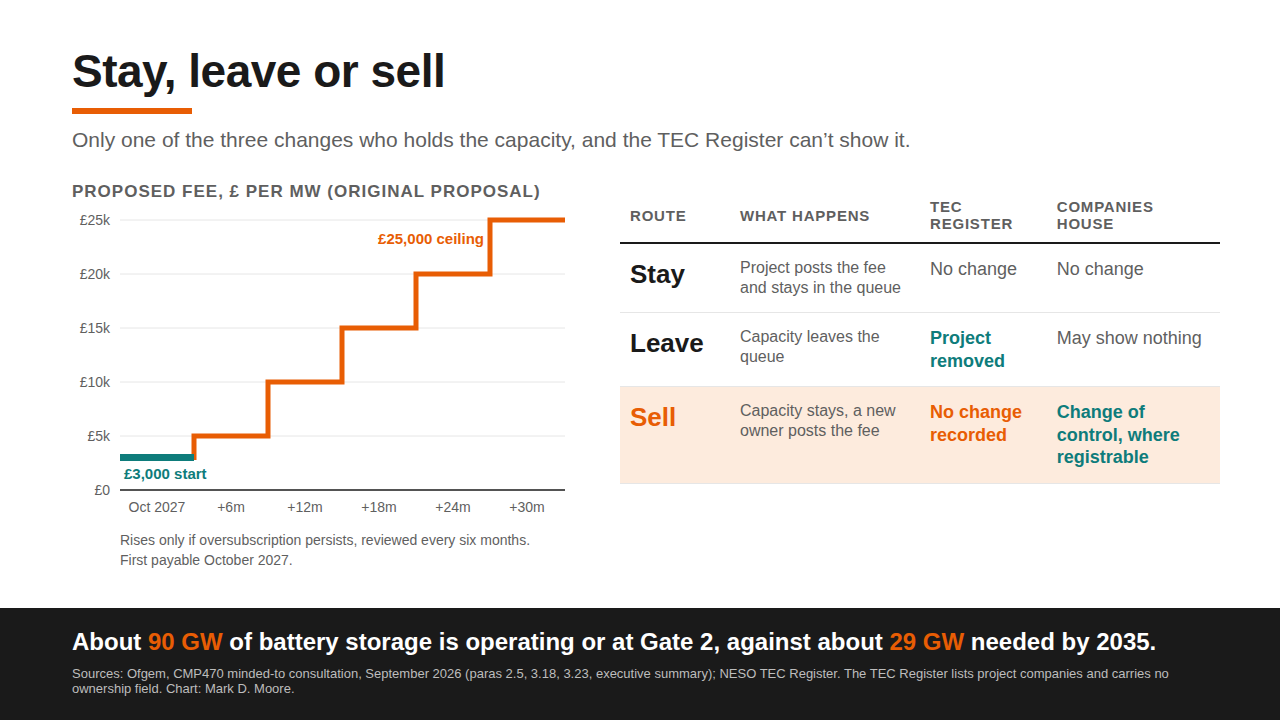
Graphic accompanying the article: Why does CMP470 make sense?

What a data centre actually buys from the grid: sources, figures and what’s still open

Published 25 September 2026 · Read the post

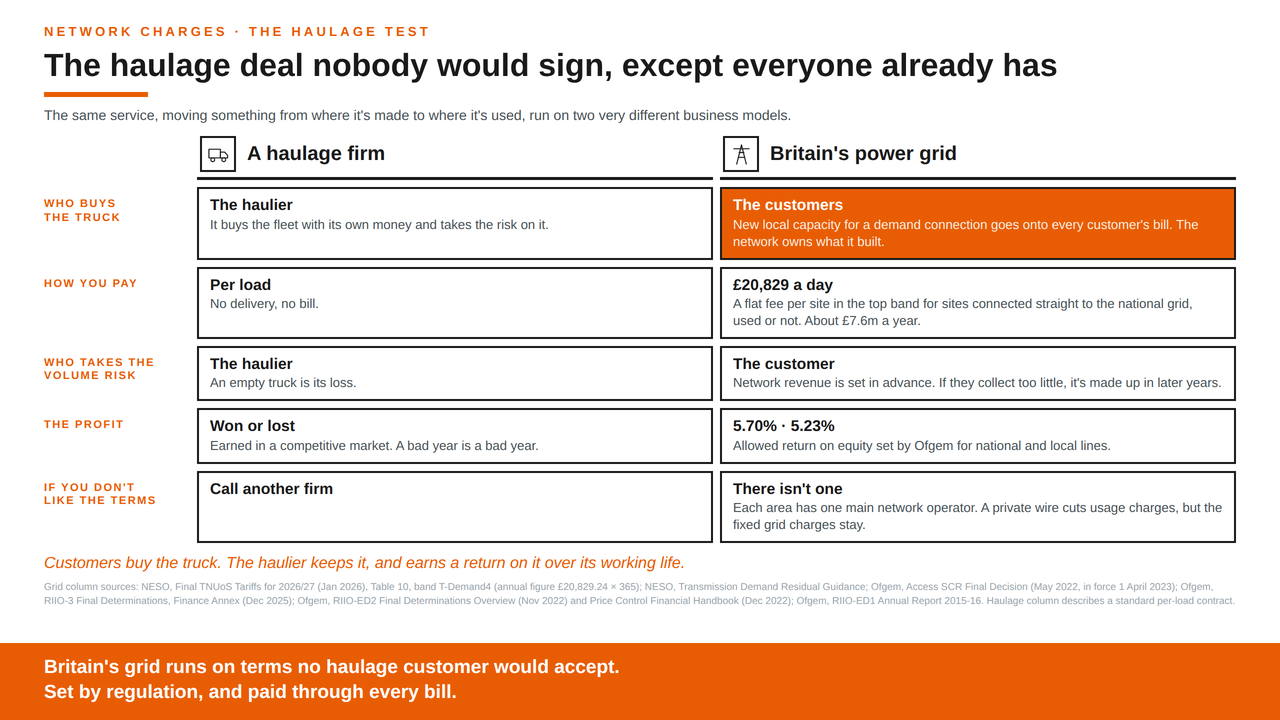
Britain’s network companies aren’t paid the way most businesses are. They’re regional franchise carriers. Their revenue is set in advance by a five-year regulatory settlement, and any gap between what they’re allowed and what they actually collect is corrected in later years. Read the full piece

Ofgem’s own explanation is that “it is not practical to collect the exact revenue allowed owing to tariffs being set before network usage is known” (RIIO-ED1 Annual Report 2015-16, p.10). The volume risk sits with customers, not the carrier. Below is what that means for a large connecting customer such as a data centre, with the source for each figure and a note of what was left out because it couldn’t be verified.

One point first. The charges below don’t all fall on the same kind of site. A site connected directly to the national transmission network pays transmission charges but no local distribution charges. A site connected to a local network pays both. The post’s three conditions come from across the system, not from a single site’s bill.

What’s charged

For sites connected directly to the transmission network, the first charge is a fixed daily transmission residual: £20,829.24 per site in the top band (T-Demand4) for 2026/27 (NESO, Final TNUoS Tariffs for 2026/27, January 2026, Table 10). NESO charges it per site per day according to band, not according to how much power the site draws. Sites are placed in bands by capacity percentile and stay there for the whole price control (NESO, Transmission Demand Residual Guidance, pp.6-8). Locational transmission charges come on top. Over a full year the residual comes to about £7.6 million per site before a single unit of power is used.

For sites connected to local networks, the cost of reinforcement is spread across all customers. Reinforcement means upgrading substations and cables to serve a new connection. Ofgem’s Access and Forward-Looking Charges Significant Code Review (Final Decision, May 2022) removed the reinforcement contribution from demand connections entirely. It moved that cost into Distribution Use of System (DUoS) charges, which every customer on the network pays (Executive Summary, p.5; sections 3.39 to 3.41). The changes took effect from 1 April 2023 (Ofgem, charging and connections update, 27 April 2023, p.4). Generation connections keep a narrower boundary: a connecting generator still pays for reinforcement at its own voltage level, and only the higher-level work is spread across customers.

Where the spending goes

Network spending is split each year by a capitalisation rate. Part is recovered from customers in the same year (“fast money”). The rest is added to the company’s Regulatory Asset Value (“slow money”), and the company’s cost of capital is calculated as “a percentage return on the licensee’s RAV” (Ofgem, RIIO-ED2 Price Control Financial Handbook, December 2022, §3.6 and §4.1). The asset base is paid down over its working life. Until then, the company earns a return on what customers have funded and it owns.

What the carrier earns

Ofgem’s RIIO-3 price control, decided in December 2025 and in force from 1 April 2026, sets electricity transmission’s allowed cost of equity at 5.70%. That figure is on a semi-nominal basis and assumes 55% notional gearing (Finance Annex, 4 December 2025, section 1.10; confirmed against National Grid Electricity Transmission’s own Final Determinations, Table 5). It replaces the RIIO-T2 baseline of 4.30%, CPIH-real. The two figures aren’t on the same inflation basis, so the rise shows the direction of travel rather than a like-for-like increase.

A second RIIO-3 figure, 6.12% at 60% gearing, is for gas transmission and gas distribution, not electricity. At least one press report has run the two together without making that clear. They’re two sectors within the same settlement, not two estimates of one number.

On the distribution side, RIIO-ED2 set a baseline cost of equity of 5.23%, CPIH-real, at 60% notional gearing (Final Determinations Overview, November 2022, section 5, pp.29 to 33).

These are allowed returns, not guaranteed profit in the strict sense. Ofgem’s RIIO-2 performance data for 2024 reports “modest operational out-performance driven by efficiencies in operating costs, capital expenditure and incentives”, plus larger gains on finance costs where high inflation interacted with the debt allowance. The baseline itself, though, is fixed by formula on a five-year cycle whatever the network’s day-to-day performance. That’s what the post means by a set return.

A short word on producers

Across Great Britain as a whole, the average transmission charge paid by generators is held between €0 and €2.50/MWh by a retained EU regulation (Commission Regulation (EU) No 838/2010). NESO sets a negative adjustment tariff to keep the average in range (NESO, Calculation of the Generator TNUoS Adjustment Tariff, May 2026, p.1). Individual generators can pay more or less than that depending on where they are; only the national average is capped.

Since April 2023, balancing costs have been charged to final demand only. Balancing costs are the cost of keeping supply and demand matched in real time. Ofgem approved that change in April 2022 under CUSC modification CMP308.

The CfD scheme is funded by “a compulsory levy on electricity suppliers in Great Britain” (Explanatory Memorandum to SI 2016/363, §7.3), which reaches customers’ bills.

That isn’t the full picture of producer economics. It’s enough to show that the carrier doesn’t set the price of what it carries.

Private wire

The alternative to the carrier is a private wire: generating power nearby and running your own line to the site. It avoids the usage-based network charges on the power it carries. It doesn’t remove the fixed charges. Ofgem’s Targeted Charging Review (December 2019) made residual charges “fixed charges for all households and businesses”. NESO’s guidance treats a site with on-site generation that stays connected to the grid as liable, and gives a data centre as its example (Transmission Demand Residual Guidance, pp.5 and 10). Even when you run your own fleet, the truck is still on the bill.

What was left out

Three claims were cut during checking rather than softened. That stranded reinforcement costs sit on customers’ bills: no Ofgem source found. That revenue corrections carry interest: not confirmed in the price control documents. That a private wire lets a site skip the regional network: wrong, as the fixed charges stay whether or not the site draws power.

Sources

NESO, Final TNUoS Tariffs for 2026/27, v1.0, January 2026.

NESO, Transmission Demand Residual Guidance.

NESO, Calculation of the Generator TNUoS Adjustment Tariff, May 2026.

Ofgem, Access and Forward-Looking Charges Significant Code Review: Final Decision, May 2022.

Ofgem, Charging and connections prioritisation update, 27 April 2023.

Ofgem, Targeted Charging Review: Decision and Impact Assessment, December 2019.

Ofgem, CMP308: Removal of BSUoS charges from Generation, decision, April 2022.

Ofgem, RIIO-3 Final Determinations: Finance Annex, 4 December 2025.

Ofgem, RIIO-3 Final Determinations: NGET, December 2025.

Ofgem, RIIO-ED2 Final Determinations Overview, November 2022.

Ofgem, RIIO-ED2 Price Control Financial Handbook, December 2022.

Ofgem, RIIO-ED1 Annual Report 2015-16.

Ofgem, RIIO-2 regulatory performance data: 2024.

Explanatory Memorandum to The Contracts for Difference (Electricity Supplier Obligations) (Amendment) Regulations 2016 (SI 2016/363).

Graphic accompanying the article: what a data centre actually buys from the grid

Four gigawatts left a connection register this year, and the register cannot say where it went.

Published 21 September 2026 · See the trackers

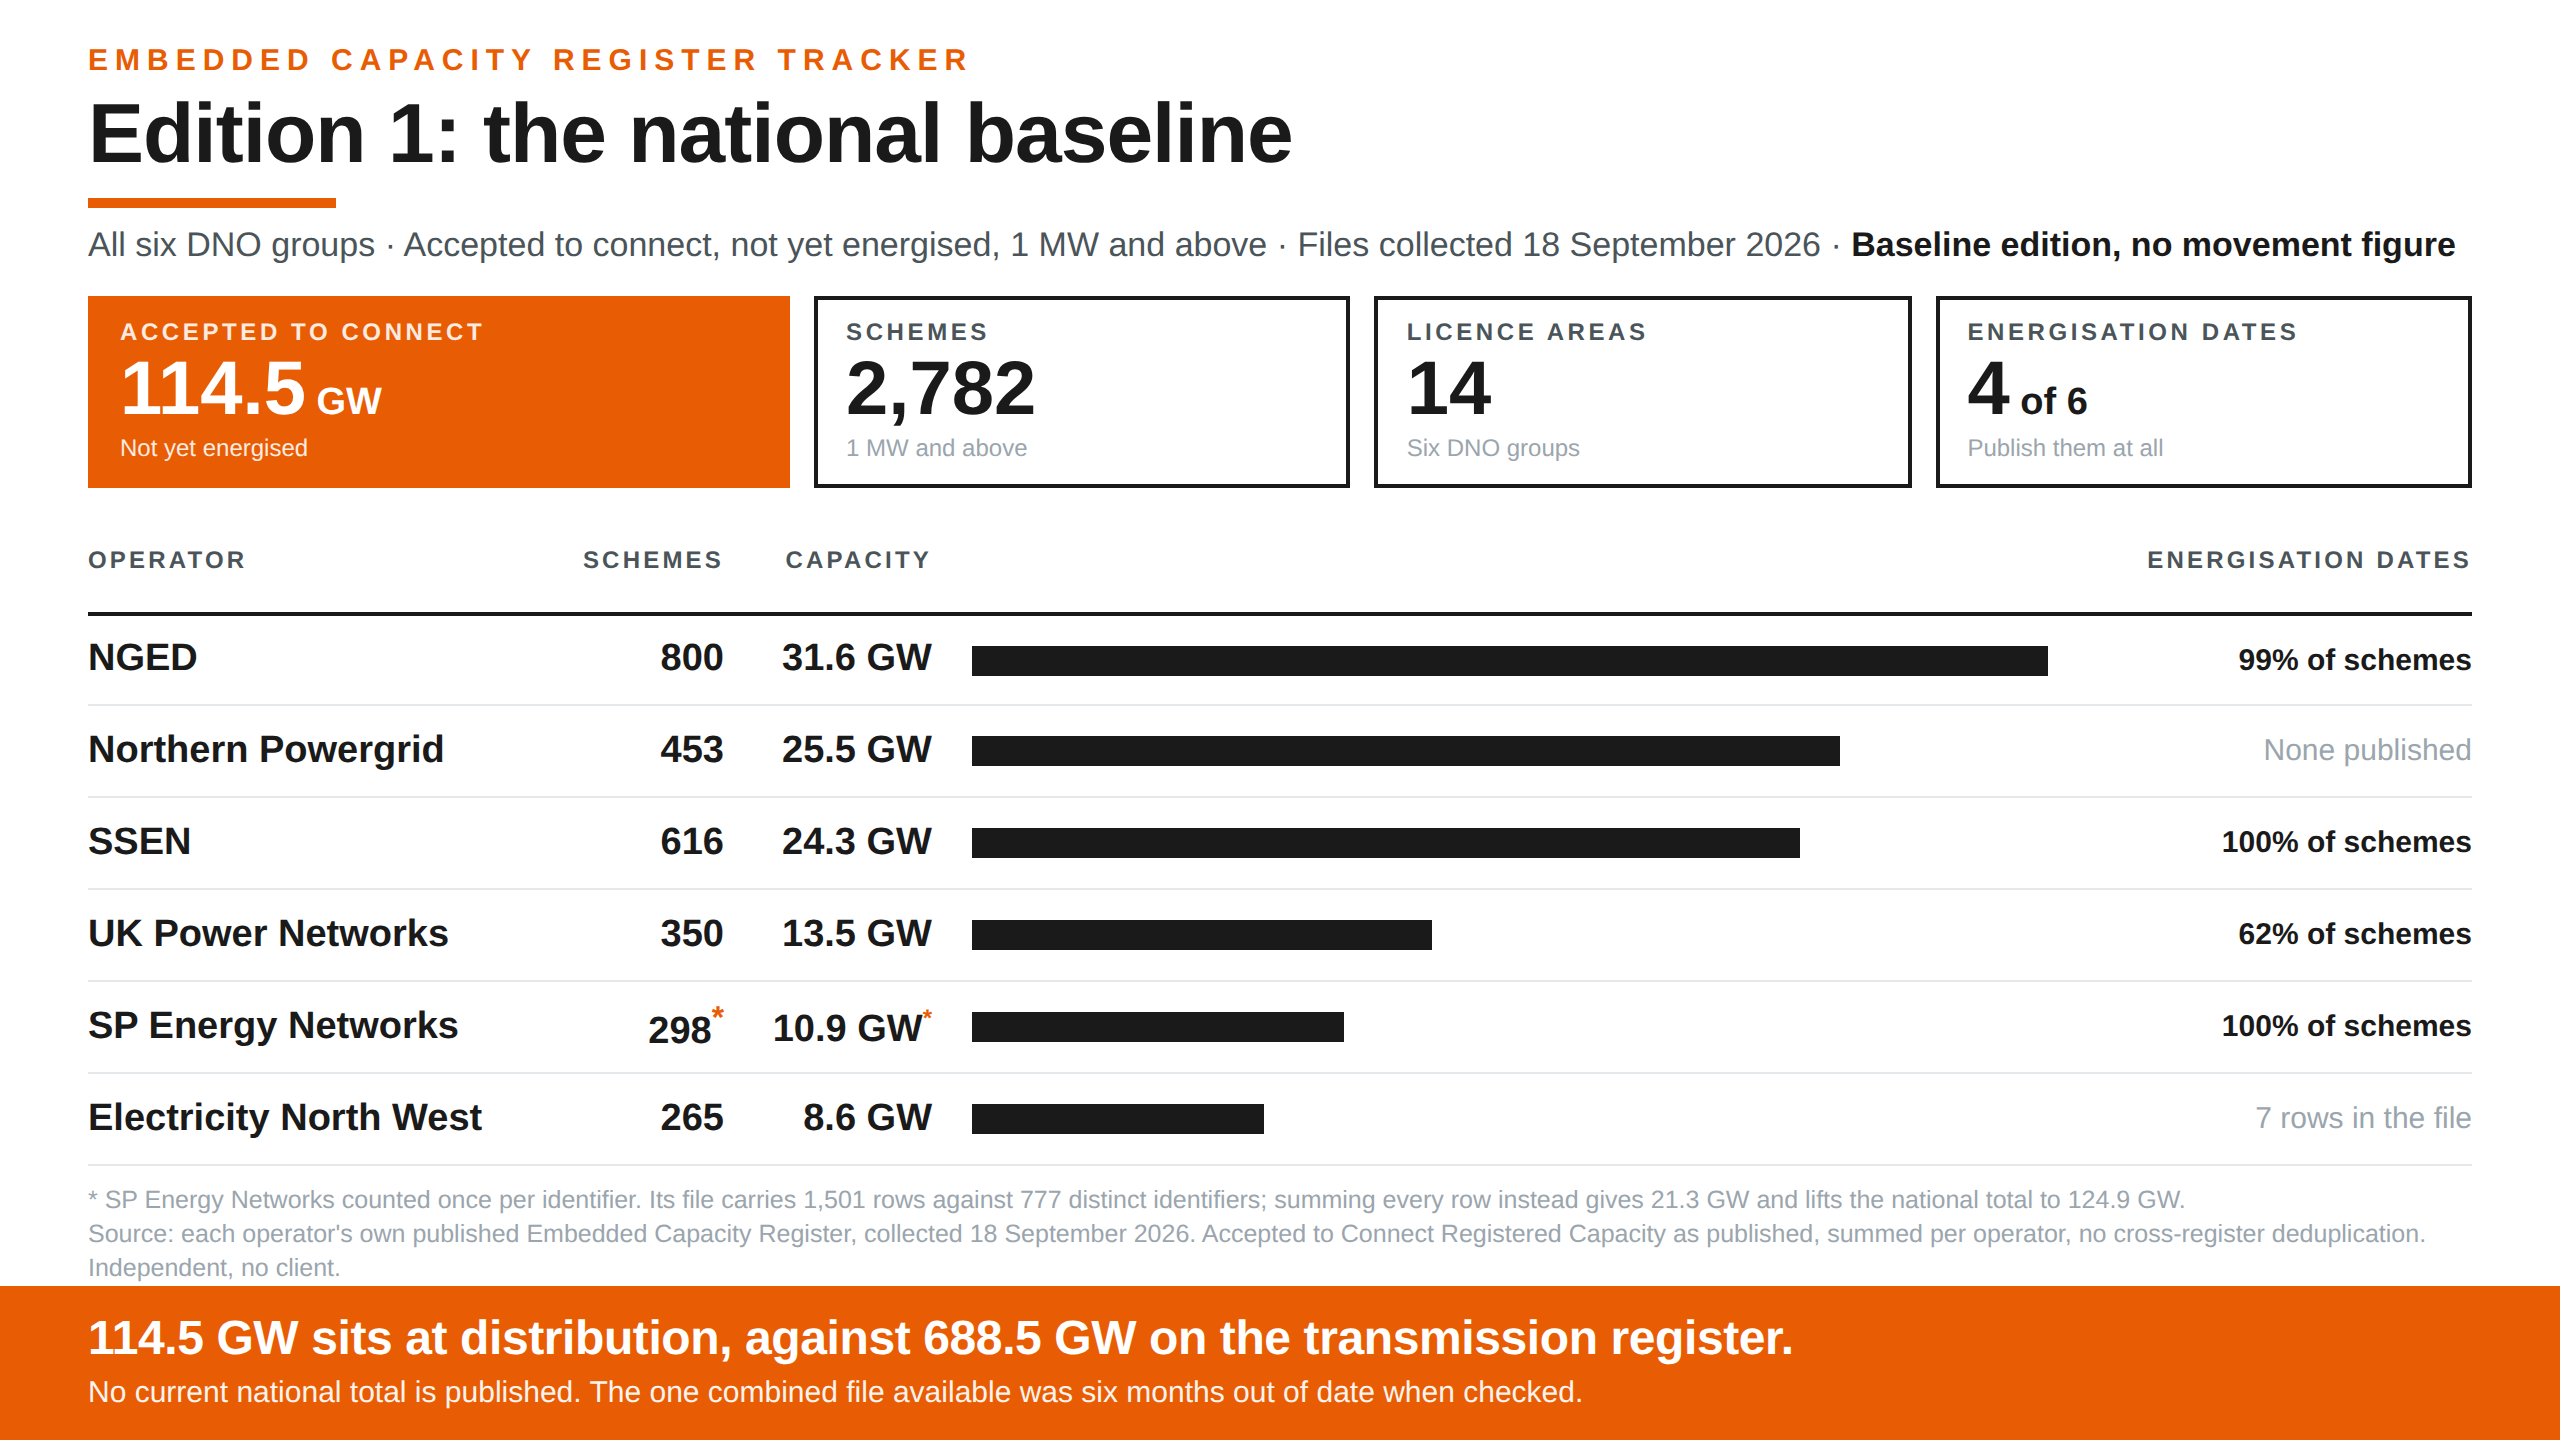
Between January and August 2026, accepted-to-connect capacity on SSEN’s Embedded Capacity Register fell by 4,054.8 MW. Connected capacity over the same period rose by 197.6 MW. Those are two columns in the same file, and nothing in the register links them. You cannot say the second came out of the first. Read the full piece

I want to be precise about the gap, because the precision is the whole point. Roughly 3.9 GW is a derived residual. It is the arithmetic difference between one column falling and another rising, and it is not a measurement of anything. Some of it energised. Some of it was re-scoped, or re-sited, or given up on. Some of it may be a correction to a figure that was wrong before. The register records none of those events, because a register is not an event log. It is a statement of contract position at a moment, and the fields populate when a contract does, not when something happens on the ground.

That distinction governs everything about how these files can be read, and it is why I publish the method before I publish the series.

Here are the rules I hold to.

Diff on a stable identifier, one row per scheme, and state the counting basis wherever a total appears. The registers invite double counting. A scheme can appear twice when it is moving between grid supply points, and if you sum the rows you will count its capacity twice.

Never describe a departure as a withdrawal. A row leaving the accepted-to-connect column tells you the contract position changed. It does not tell you the project died. Treating the two as equivalent produces a story about collapse that the data does not support, and the mistake is easy to make because collapse is the more interesting story.

Never sum registers that do not share a population. The NESO Embedded Register covers Scotland only. The DNO Embedded Capacity Registers cover the fourteen licence areas. Adding them produces a number that describes nothing.

Treat dates as fields, not facts. A target energisation date is defined in the governing template as an estimate “likely to change to reflect the latest date notified by customers”. It is what the customer last said, recorded when someone got round to recording it.

Fix the snapshot provenance before anything else. NESO overwrites each publication, so a file you did not download on the day is gone. The publication date in the filename is the only provenance record, which is why I never rename a downloaded file.

None of that is difficult. It is just slow, and it has to be done the same way every week or the series means nothing.

The distribution registers are harder than the transmission one, and I spent yesterday finding out how much harder. The governing template has mandated a Unique Site Identifier since February 2026, defined as an identifier that “distinguishes each entry uniquely rather than use site name”. Seven months on, three of the six DNO groups do not publish it at all. Of the three that do, one publishes an identifier that repeats across paired rows, so it is not unique. Another publishes one that has the connection status written into the string, which means it changes the moment a scheme energises, so it cannot follow a project across precisely the transition you would want to track. One publisher, out of six, has an identifier that is both unique and durable.

There is a reason to say this out loud rather than quietly work around it. Connections reform is being run to targets. If the registers that record its progress cannot support a consistent count across editions, then the reporting on it rests on people rebuilding the same fragile joins in private, each slightly differently, and nobody being able to check anyone else’s number.

Tomorrow I publish the first edition of the Embedded Capacity Register tracker, covering all six DNO groups. It will carry the national accepted-to-connect position, the method used to arrive at it, and the places where I could not arrive at one cleanly and have said so instead.

One question I cannot answer from the files. When capacity leaves the accepted-to-connect column, somebody knows whether it energised or whether it went away, because somebody countersigned the paperwork either way. What would it actually cost to publish that, and who decided it was not worth recording?

Provenance: Primary. SSEN movement computed from its published Embedded Capacity Register, January and August 2026 editions. Template and identifier findings from the DCUSA Agreed Version 5.0 register template and the six DNO groups’ own current files, collected 18 September 2026.

Embedded Capacity Register tracker graphic, Edition 1

72.8 GW requested, 4 GW connecting, 1.4 GW drawn: the workings behind the data centre queue

Published 18 September 2026 · Read the post

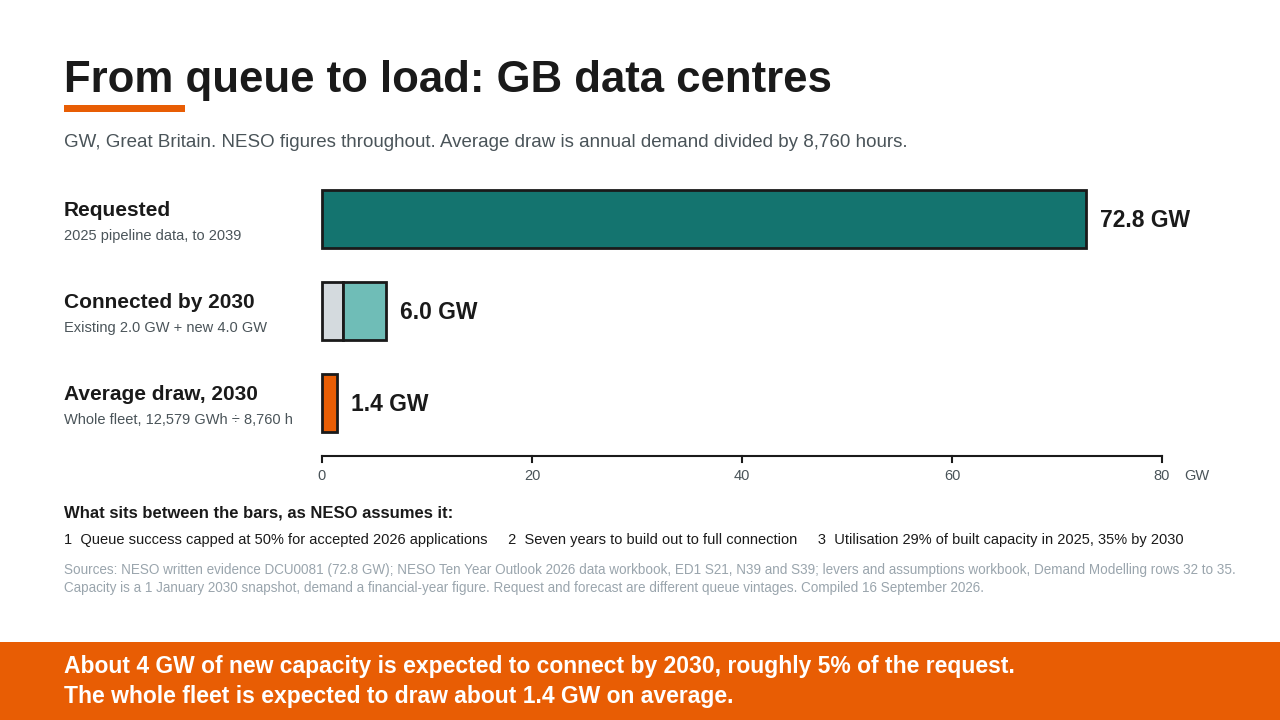
The appendix to Friday’s post on the data centre pipeline. Three headline numbers — 72.8 GW requested, 4 GW connecting by 2030, 1.4 GW of average draw — traced back to NESO’s own workbooks, with the arithmetic shown in full, plus the connection-terms clause that already lets network operators claw back unused capacity. Read the full piece

This is the appendix to my post of Friday 18 September. The post gives three numbers for Great Britain's data centre pipeline. This piece shows where each one comes from, how the arithmetic runs, what the sources assume, and what the figures cannot tell you. Anyone with the three source documents open should be able to reproduce every figure here in a few minutes.

All the underlying data is NESO's or TwentyForty's. The calculations are mine, as is the reading of the connection terms, and one observation comes from an original research project of my own that has not yet been published. Where that is the case, I say so.

1. The three numbers

Requested: 72.8 GW of data centre connection requests through to 2039. Source: NESO's written evidence to the Environmental Audit Committee (DCU0081), based on pipeline data collected in 2025 from transmission and distribution network operators.

Expected to be connected by 2030: 6.04 GW in total, of which 2.02 GW was already connected at 1 January 2025, so about 4.0 GW is new. Source: NESO Ten Year Outlook 2026 data workbook, sheet ED1, cells S39 (1 January 2030) and N39 (1 January 2025).

Expected average draw in 2030, whole fleet: about 1.4 GW. Source: derived from the same workbook, sheet ED1, cell S21, which gives 12,579 GWh of data centre demand in financial year 2030.

2. The arithmetic

Average draw. NESO gives demand as energy over a year, not as power. Dividing annual energy by the hours in the year converts it: 12,579 GWh divided by 8,760 hours gives 1.436 GW, which I round to 1.4 GW.

New capacity connecting between 1 January 2025 and 1 January 2030: 6.04 GW less 2.02 GW is 4.03 GW. As a share of the 72.8 GW requested, that is 5.5 per cent. The 6.04 GW total cannot be set against the request directly, because it includes the fleet that was already connected before the 2025 pipeline data was collected.

The 1.4 GW of average draw is likewise a whole-fleet figure, existing sites included. It describes how hard the connected fleet is expected to work, not how much of the queue turns into load, and I do not express it as a share of the request.

Average draw as a share of connected capacity in 2030: 1.436 GW divided by 6.04 GW is 24 per cent. That sits below NESO's own utilisation assumption of 35 per cent for 2030, and the gap is expected rather than an error. NESO's figure is measured against built capacity, and it assumes new sites take seven years to build out to their full connection, so in any given year built capacity is less than connected capacity. Measured against the larger connected figure, the same demand gives a lower percentage.

The same check runs on 2025. The workbook gives 4,603 GWh of demand for financial year 2025, an average of 0.53 GW, against 2.02 GW connected at 1 January 2025. That is 26 per cent of connected capacity, again below NESO's 29 per cent of built capacity for the same year. The figures hang together.

One further split is visible in the workbook. Of the 6.04 GW connected by 2030, 2.19 GW is at transmission level and 3.86 GW at distribution level (cells S40 and S41). Transmission-connected capacity was 0.02 GW at 1 January 2025 (cell N40), so almost all of the 2.19 GW is new. NESO's evidence to the committee puts nearly 59 GW of data centre requests in the transmission queue alone. On NESO's own numbers, about 2.17 GW of that, roughly 3.7 per cent, is connected by 2030.

3. What NESO assumes

The Ten Year Outlook 2026 assumptions workbook (sheet Demand Modelling, rows 32 to 35) sets out the four levers that turn the queue into demand.

Queue success. NESO applies a maximum success rate of 50 per cent to projects with accepted applications in 2026, falling over time and for applications that are less progressed. It records that the rate was reduced from last year because the 2026 queue data contains more speculative projects. The queue itself is listed in NESO's bibliography as not public data, so the size of the 2026 queue behind the 6.04 GW cannot be checked from outside.

Ramp. New data centres are assumed to take seven years on average to build out to their connection capacity, adding one seventh each year.

Utilisation. NESO assumes a fleet-wide average of 29 per cent utilisation of built capacity in 2025, rising to 35 per cent in 2030 and holding there. The 2025 value comes from data centre utilisation data supplied by UK Power Networks and National Grid Electricity Distribution. The increase to 2030 rests on stakeholder feedback that greater AI use should raise utilisation.

Efficiency. No net reduction in demand from efficiency improvements is assumed within the ten-year window.

4. What changed since last year

NESO's evidence to the committee described its previous ten-year forecast as around 5.2 GW of connected data centre capacity and just over 20 TWh of demand by 2030. The 2026 outlook raises capacity to 6.04 GW and lowers demand to 12.6 TWh.

The two moves pull in opposite directions for one reason. NESO records that the new utilisation data reduced its assumption from a flat value of around 70 per cent used in Future Energy Scenarios 2025 to 29 per cent. More capacity is expected to connect, and each megawatt of it is expected to do much less work.

5. What the meters show

NESO's utilisation figure is a modelling assumption. TwentyForty, the freight infrastructure body, has published the metered picture for one network. Its report Power In (July 2026) analyses UK Power Networks' half-hourly utilisation records for all 96 data centres on its distribution network, more than five million readings since January 2023.

TwentyForty found that the median site drew 18 per cent of the capacity it had contracted, and the twelve largest connections ran at a median of 7 per cent. On a peak basis, nearly half the sites never exceeded 40 per cent of their booked capacity, even in their single busiest half-hour across three years. The credit for that analysis is TwentyForty's, and anyone interested in the detail should read the report.

The two sources measure different things and should not be combined. TwentyForty's 18 per cent is average draw against contracted capacity at existing sites on one network. NESO's 29 per cent is average utilisation of built capacity across the whole fleet, used as a forecasting input. They point the same way from different methods, which is as far as the comparison goes.

6. What the connection terms already allow

This section draws on an original research project of mine on the utilisation of industrial connections, which is currently unpublished.

Large distribution-connected sites with current-transformer metering are covered by Section 3 of the National Terms of Connection, currently version 23.0, effective 22 January 2026. Clause 12.11C of that section provides that where import through a connection point does not, at any time during any twelve consecutive months, exceed 75 per cent of the Maximum Import Capacity, the network operator may, within the following month and having due regard to all the circumstances, propose a reduction. The reduction can be no lower than the highest import in that period. The provision was introduced by change proposal DCP115 and approved by the Authority in July 2015.

The test in the clause is a peak test. It asks whether import ever exceeded 75 per cent in a year, not what the average was. That makes TwentyForty's peak finding the relevant comparison rather than either average figure: on its data, nearly half of UK Power Networks' data centres never once went above 40 per cent of booked capacity in three years.

The limits need stating as plainly as the finding.

The right is discretionary, and a proposed reduction does not bind unless it is agreed, or determined under Clauses 12.12 or 14. Capacity agreed within the previous twelve months is protected by Clause 12.13.

It applies only to distribution connections on the National Terms. Transmission-connected sites, 2.19 GW of NESO's 2030 figure, are contracted on different terms. Existing bespoke agreements also displace Section 3 under paragraph F of Section 1, and large sites frequently hold them.

TwentyForty's contracted capacity is very likely the same quantity as Maximum Import Capacity, but I have not confirmed that from the report's method notes.

I have found no published figure for how often network operators use the clause. The right exists. Whether it is exercised is a separate question, and it is one my research has yet to answer.

7. A note on Scotland

In the same evidence, NESO says that with sufficiently strong locational signals a maximum of 20 per cent of future data centre demand could be located in Scotland. The roughly 7,150 MW of Scottish applications used in my post of 15 September is about 10 per cent of the 72.8 GW GB figure. The two numbers come from different compilations on different dates, so the comparison is directional only.

8. What these figures cannot show

The 72.8 GW is 2025 pipeline data. NESO's 2026 outlook is built on a later, larger queue that is not published, so the request and the forecast are not the same vintage.

The 6.04 GW and the 1.4 GW describe the whole connected fleet, including sites connected before 2025. Only the increase in capacity, about 4.0 GW, can be compared with the request.

Capacity is a snapshot at 1 January; demand is a financial-year total. That is adequate for a figure rounded to 1.4 GW and not for anything more precise.

NESO's Ten Year Outlook is, in its own words, not designed for network planning or connections. It is a view of the current trajectory, not a plan.

Utilisation in the outlook rests on two distribution network operators' data. TwentyForty's metered analysis covers one. Neither covers transmission-connected sites, where most of the new capacity sits.

Average draw says nothing about peak. A network is sized for the busiest half-hour, not the average, which is why this piece does not compare 1.4 GW with winter peak demand.

9. Reproducing the figures

Download the Ten Year Outlook 2026 data workbook and assumptions workbook from NESO's Future Energy Scenarios documents page. In the data workbook, sheet ED1, read row 21 for annual data centre demand and rows 39 to 41 for connected capacity, taking the 2025 and 2030 columns (N and S). In the assumptions workbook, read sheet Demand Modelling, rows 32 to 35. The 72.8 GW, the 59 GW transmission figure and the 20 per cent Scotland ceiling are in NESO's written evidence DCU0081 on the Parliament committees website. TwentyForty's figures are on its Power In report page, and the connection terms are published by the Energy Networks Association.

10. Sources

NESO, Written evidence to the Environmental Audit Committee, DCU0081. committees.parliament.uk/writtenevidence/166090/html

NESO, Ten Year Outlook 2026 data workbook, v001, and levers and assumptions workbook, v001. neso.energy/publications/future-energy-scenarios-fes/fes-documents

TwentyForty, 12 Pillars of Change: Power In, July 2026. twentyforty.uk/twelve-pillars/power-in

Energy Networks Association, National Terms of Connection, version 23.0, effective 22 January 2026. energynetworks.org/publications/national-terms-of-connection

If most of the data centre capacity being connected is expected to sit well below its booked level for years, and the distribution terms already provide a route to recover it, what should happen to that capacity before the network builds for the rest of the queue?

Analysis. The data is NESO's and TwentyForty's, and I have linked both. The arithmetic and the reading of the connection terms are mine; the clause observation comes from an original research project that is currently unpublished.

From queue to load: GB data centres. Requested 72.8 GW, connected by 2030 6.0 GW, average draw 2030 1.4 GW.

Your biggest customer might have changed ownership twice. Did anyone tell you?

Published 10 August 2026 · View on LinkedIn · Read the post

Almost certainly not, and there's no particular reason anyone would have. Nothing you can see changes when it happens. Your contact is the same person, the letterhead is the same, the pipeline you're quoting against is the same pipeline, and the name in your CRM hasn't moved. Underneath all of that, the company you're actually contracting with can have been sold twice in eighteen months. Read the full piece

I wrote a fortnight ago about how many customers you really have, which was a counting problem, fifteen doors resolving to about ten buyers. This is a different problem and it's the one I think is more expensive. Not how many there are, but whether the one you think you know is still the one you think it is.

Why a supplier should care

Three things move when ownership moves, and none of them announce themselves.

Credit is the obvious one. You almost certainly aren't contracting with the developer whose name is on the door, you're contracting with a ring-fenced project company, and what stands behind that company is entirely a function of who owns it. A project company under a large infrastructure fund is a different credit from the same project company under a small private platform, and the entity number on your contract doesn't change when the owner does.

Then there's the parent company guarantee. If you negotiated one, you negotiated it against a parent that may no longer be in the structure. If you didn't ask for one because the ultimate owner looked strong enough, that assessment has quietly expired.

And then authority. Who can actually approve your order, at what value, and whether that threshold survived the transaction. Procurement tends to centralise after a platform acquisition, which is usually the point at which suppliers discover it, and by then it's a live tender rather than a conversation.

This isn't anyone behaving badly

East Yorkshire Solar Farm is about 400MW, 530MWp, consented in May 2025 and sold by Boom Power to Ampyr Solar Europe. The register handles it perfectly. Control changes on 19 February 2026, the old holder ceases and ASE UK Holdings Limited is notified the same day, the outgoing director resigns that day and five new ones arrive within a fortnight. Prompt, accurate, complete.

Go up one level and ASE UK Holdings' own controller is a Dutch entity, notified in December 2021, and the UK register stops there. That's not evasion, it's the design. Name a foreign legal entity as your controller and you've discharged the obligation. So the trail doesn't get hidden, it just ends.

I've used Ampyr deliberately because they've done everything right. If I'd picked a business with a messy filing record you could fairly say I went looking for a bad actor. A well-run European IPP buying a consented project properly, and a British supplier still unable to establish who ultimately stands behind it, is the harder version of the problem. The same holding company sits above two other solar projects I found without looking hard, and carries 26 subsidiaries, so it isn't one relationship at stake either.

And it isn't rare

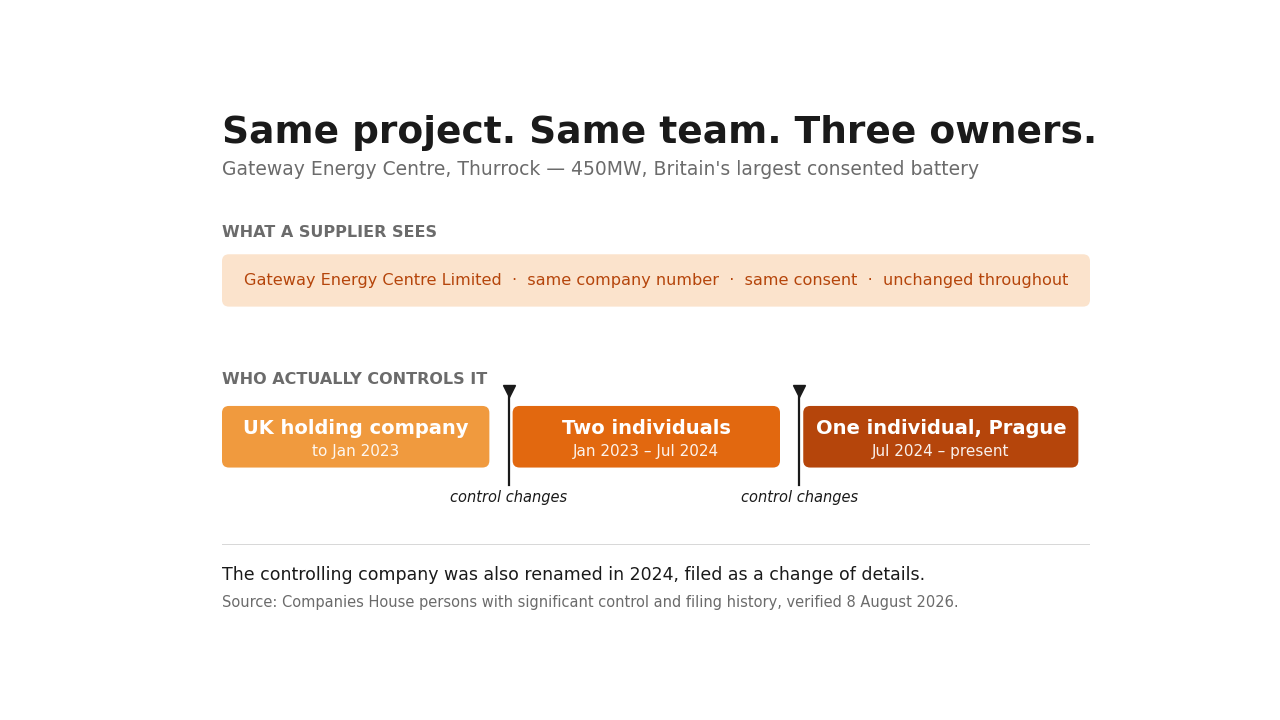
Gateway Energy Centre in Thurrock is 450MW, the largest consented battery in the country. Its controlling company is called Green Bess Developments (UK) Limited, which appears nowhere in the trade press, largely because until early 2024 it was called InterGen Projects (UK) Limited. The change is on the register, filed as an amendment to details, so nothing on the project company's own page tells you those two names are the same business.

Keep going and it does resolve, to a single individual resident in Prague, sole controller since July 2024. Before him, two individuals from January 2023. Before them, a UK holding company. Three eras of control in eighteen months on Britain's largest consented battery, and no fund anywhere in the chain, which is not what the market maps imply for an asset that size.

If you were selling into that project across those eighteen months, you were dealing with the same team about the same consent the whole way through.

Why you can't see it even when nothing is hidden

Here's the part I nearly overstated, so I'll be straight about the evidence.

Keeping the existing chief executive after an acquisition is normal, and it's measured. Bargeron, Schlingemann, Stulz and Zutter put target CEO retention at around 68 per cent in private equity deals, against roughly 31 per cent where both sides are public companies. That's textbook and I'm citing it to show what normal looks like, not to prove a point.

Statera is the clean example. EQT bought it from InfraRed in November 2023. Nearly three years on, the founder is still chief executive, the brand is unchanged, and there are three EQT people sitting on the board alongside an independent director. Control is entirely legible if you read the board. It's invisible if you read the brand, and it's invisible if you simply keep dealing with the person you dealt with in 2022. That combination, real continuity of people on top of real change of owner, is why this doesn't feel like anything from the outside.

What I can't tell you is that it lasts. Practice data puts chief executive retention through a full hold below 20 per cent, most replaced across five or six years. Statera at three years, and Aypa holding its founder across two owners while changing its name from NRStor C&I along the way, are unusual rather than typical. So this is a mechanism I can show you working, not a rule about how often it works.

What the research all misses

Every study I can find on retention asks the same question, which is whether keeping the chief executive helps or hurts the shareholders and what it does to the acquisition premium. That's a governance question and it's reasonably well answered.

Nobody appears to have asked what it does to the counterparties. Suppliers, lenders and contractors price risk off a name and a relationship, and both survive the transaction completely intact. There's solid work reading the ownership register at scale, Jofre and Knobel published across 5.2 million beneficial owners in May 2025, but it's aimed at corruption and laundering. As far as I can find, nobody has pointed it at a sector and asked what the pattern means for the businesses trading with it.

How far this reaches

Two things from the wider work, briefly, because they set the scale.

First, a correction. In the first article I said a small number of international funds hold positions on both the renewable and data centre side. Having closed the population properly, top fifteen by capacity, that doesn't hold at the top of the market. Four of the top six resolve to private origination platforms with no connection to the funds I named. Origination is size-stratified, and institutional capital tends to arrive after consent rather than originate anything. Wrong first time, corrected in the open.

Second, I tested whether the current wave of deals is operating platforms buying developers, which is how the sector reads it. I wrote the threshold down first, four of seven deals had to fit. One did. The other six were financial capital, a take-private, an asset joint venture, a sponsor-to-sponsor rotation, a joint venture buyout and two minority investments. So the popular reading of the market is wrong, and what's actually happening is ownership moving underneath businesses that carry on looking identical.

One more reason this is about to matter

Ofgem's Curate consultation proposes a data centre commitment fee of between £237,500 and £712,500 per MW, returnable at energisation and forfeited on early exit. Whatever you make of the calibration, a fee at that level is a credit test, and credit tests select for balance sheet. If holding a queue position starts to need capital only the largest owners comfortably have, the customer base concentrates further through a mechanism nobody designed for that purpose. It closes on 16 September.

The question

I've spent three weeks doing this by hand and the summary is that the register is transparent without being legible. Everything is filed. Almost none of it is readable at the moment somebody needs to make a decision.

So, for anyone running sales, credit or procurement in this supply chain. When did you last check who actually owns your three largest customers, and when you checked, did the answer match the name on the invoice?

Ownership traced through Companies House filings, published transaction announcements and company statements, verified 8 August 2026. Corrections welcome, as always.

Graphic accompanying the article: Your biggest customer might have changed ownership twice. Did anyone tell you?

A five to seven year BESS requirement selects the founding cohort

Published 5 August 2026 · View on LinkedIn · Read the post

I have read a lot of BESS and data centre job descriptions this year. The experience requirements stopped making sense, so I looked into why. Read the full piece

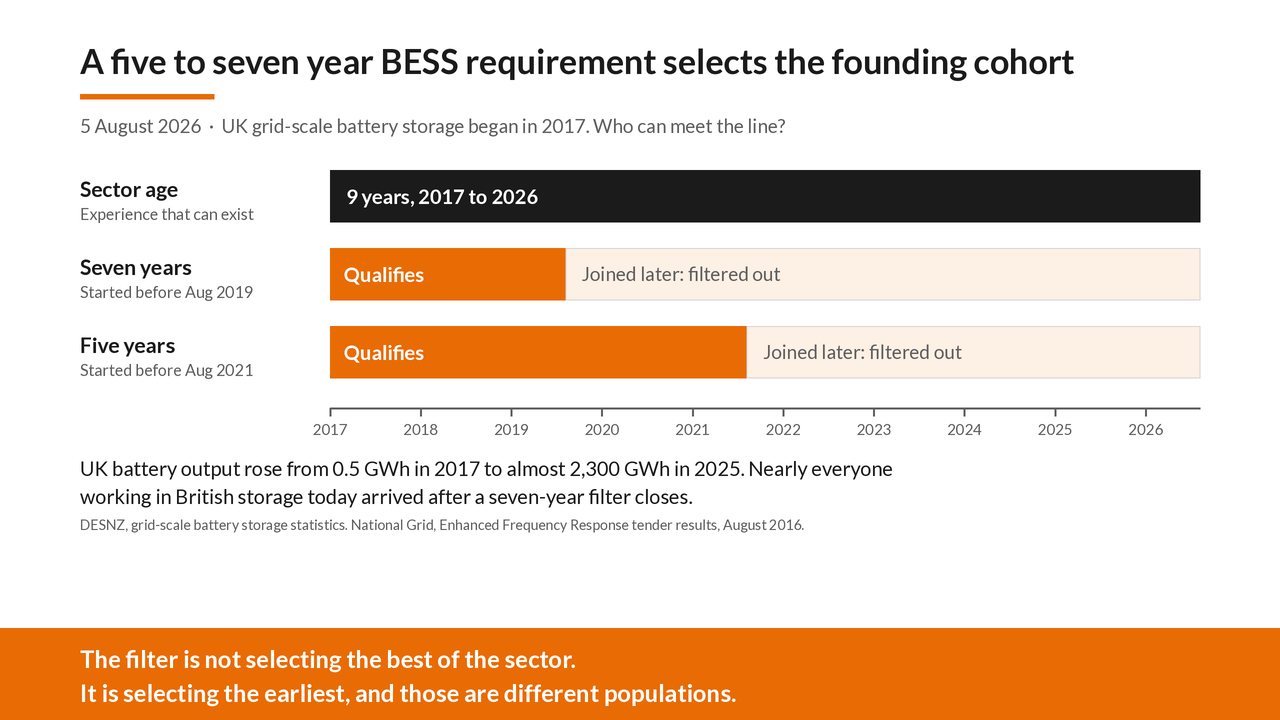
Start with the arithmetic, because it settles half the question on its own. DESNZ records the first major grid-scale battery storage project in the UK as becoming operational in 2017. The year before that, National Grid ran its first Enhanced Frequency Response tender and awarded 201 MW across eight projects, each between 10 and 49 MW, drawn from 64 pre-qualified sites. That tender is the commercial starting gun for grid-scale storage in this country. Everyone who has built, financed, connected or optimised one of these assets started, at the earliest, around then.

So the maximum grid-scale BESS experience available to anyone in Britain is roughly nine years. The requirements I keep seeing are not asking for ten, they sit at five to seven, and that is where it gets interesting, because those two numbers do very different things.

Seven years, counted from now, means you were working in UK grid-scale storage before August 2019. That is inside the first two and a half years of the sector, when the EFR fleet had only just energised. Five years means before August 2021, which is roughly the first half of the sector’s life. Seven bites hard, five is a good deal softer, and specifications that write “five to seven” as though it were one requirement are papering over the difference.

The scale point is what makes the seven-year version so narrow. DESNZ records annual output from UK batteries rising from 0.5 GWh in 2017 to almost 2,300 GWh in 2025. Output is a proxy for the size of the sector rather than a headcount, so treat it as indicative, but the direction is not in doubt. Almost everybody now working in British battery storage arrived after the point at which a seven-year filter closes. The filter is not selecting the best of the sector, it is selecting the earliest, and those are not the same population.

That founding cohort is also, by any reasonable reckoning, already employed. I have seen the retirement argument made about this group and I do not think it holds, because the people who went into grid-scale storage in 2017 were mostly early-stage developers, optimisers and fund-side analysts rather than the ageing asset-owner workforce the utilities data describes. The reason the pool is thinner than the headline suggests is simpler. Everyone in it has a job, and the sector competes for them rather than growing more.

Data centres are a different problem, and I want to be careful not to lump the two together, because doing so is where most commentary on this goes wrong.

One is a ceiling, the other is a flow

Data centres are not an emerging sector. Uptime Institute is blunt that the industry has been short of staff and skills for more than a decade, so nothing about the age of the sector constrains the candidate pool. The constraint there is the rate at which the industry builds against the rate at which it trains, and the two have separated.

Uptime’s Global Data Center Survey 2025 puts numbers on it. Around 46 per cent of operators report difficulty finding qualified candidates for vacant roles, and 37 per cent struggle to hold on to the staff they have. What changed in 2025 is where the shortage sits. Operations management roles overtook junior and mid-level positions as the largest reported gap, as experienced managers and engineers retire without enough trained successors behind them. Roughly a quarter of the people who leave are poached by competitors, and only a small proportion leave the industry altogether, which tells you the sector is recycling a fixed population rather than growing one. Uptime’s own research director makes the point that for the first time operators are finding senior recruitment harder than early-career recruitment.

The same shape shows up in the wider transition. LinkedIn’s Green Skills Report 2025, drawn from its membership base across 84 countries, records green hiring growing at about 7.7 per cent a year against 4.3 per cent growth in the share of workers acquiring green skills. In the UK the split is 7.8 per cent against 3.4 per cent. Demand is running at roughly twice supply and has been for several years.

Two different mechanisms, then. In storage the pool has a hard ceiling set by when the sector began. In data centres the pool is bounded by training throughput and drawn down at the senior end by retirement. What the two have in common is that the job description is written as though neither constraint existed.

The filter does not do what it is supposed to do

This is the part I found most useful, and it is the part nobody writing job descriptions seems to know about.

Van Iddekinge, Arnold, Frieder and Roth published a meta-analysis in Personnel Psychology in 2019 covering 81 independent samples, asking a simple question: does the experience someone brings from before they were hired predict how well they then perform? The corrected correlation with job performance came out at 0.06, across 44 samples and 11,785 people. Training performance managed 0.11. The correlation with whether someone stays with the employer was 0.00, across 32 samples and 11,676 people.

An r of 0.06 is under half a per cent of variance explained. Put plainly, the years-of-experience line is close to uninformative about the thing it exists to predict. It is not weakly useful, it is barely distinguishable from noise.

There is a fair objection to that finding and I will make it myself rather than wait for the comments. The samples are drawn from people who were already hired, and those people were selected partly on experience in the first place, which truncates the range and pushes correlations down. The authors deal with this in the paper. It does not rescue the requirement, but anyone citing the number should know the objection exists.

The employers, meanwhile, already agree. Harvard Business School’s Project on Managing the Future of Work, with Accenture, surveyed 2,250 executives across the US, UK and Germany for its 2021 study Hidden Workers: Untapped Talent. Some 88 per cent accepted that qualified, high-skilled candidates are screened out of their processes because they do not match the exact criteria in the job description. For middle-skills roles the figure reaches 94 per cent. This is not campaigners saying it, it is hiring executives saying it about their own systems.

So why does it persist

The best evidence on the mechanism comes from Modestino, Shoag and Ballance, published in the Review of Economics and Statistics in 2020. Using a large database of online postings they showed that education and experience requirements rise when the supply of available candidates rises, within the same occupations and job titles, identified partly through troop withdrawals from Iraq and Afghanistan as an external shock to local labour supply. Their estimate is that the rise in unemployment between 2007 and 2010 lifted the share of postings demanding two or more years of experience by 3.5 percentage points, and that labour supply accounts for 18 to 25 per cent of the total increase in requirements over that period.

That work is American, it covers middle-skill occupations, and it is set in a recession, so I would not transplant it directly onto senior UK energy roles. What it establishes is the mechanism. The requirement is a rationing device, calibrated against how many CVs the employer expects to sift, not against what the job actually needs.

Which leaves an obvious question. If requirements track candidate supply, thin supply should produce modest requirements, and in BESS it plainly does not. My working explanation, and I flag it as a hypothesis rather than a finding, is template transfer. The people writing these specifications came from oil and gas, thermal generation and engineering construction, where ten to fifteen years is an unremarkable line to write, and the convention travelled into a sector too young to support it.

Nor is the stated remedy arriving. The Burning Glass Institute and Harvard Business School examined 11,300 roles where employers had publicly dropped degree requirements and found the share of hires without a degree rose by 3.5 percentage points, which works out at fewer than one in 700 hires across the economy. Around 45 per cent of the firms that announced a change made no measurable difference to who they actually hired.

What I take from it

If you are being ruled out of these roles, the filter that removed you was not measuring your ability to do the work. That is not consolation, it is the finding, and it comes from a meta-analysis of 81 samples rather than from anybody’s bruised feelings.

For anyone writing the specification, the cost of the unmet requirement lands on you. It lands as vacancy duration, and per Uptime it lands hardest at exactly the seniority where the shortage is now worst. A specification that cannot be met is not a high bar, it is an unfilled seat.

The question I’m asking myself, and I do not have a clean answer to it, is what the honest replacement looks like. If years in sector predicts almost nothing, and the sector is too young to supply the years anyway, what should the line in the job description say instead, and would a hiring panel trust it?

References

Van Iddekinge, C. H., Arnold, J. D., Frieder, R. E., & Roth, P. L. (2019). A meta-analysis of the criterion-related validity of prehire work experience. Personnel Psychology, 72(4), 571–598. DOI: 10.1111/peps.12335

Modestino, A. S., Shoag, D., & Ballance, J. (2020). Upskilling: Do Employers Demand Greater Skill When Workers Are Plentiful? Review of Economics and Statistics, 102(4), 793–805. DOI: 10.1162/rest_a_00835

Fuller, J. B., & Raman, M. (2021). Hidden Workers: Untapped Talent. Harvard Business School Project on Managing the Future of Work, with Accenture.

The Burning Glass Institute & Harvard Business School Project on Managing the Future of Work (2024). Skills-Based Hiring: The Long Road from Pronouncements to Practice.

Uptime Institute (2025). Global Data Center Survey 2025.

LinkedIn Economic Graph (2025). Green Skills Report 2025.

Department for Energy Security and Net Zero (2026). Grid-scale battery storage statistics, DUKES 2026 methodology note.

National Grid (2016). Enhanced Frequency Response tender results, August 2016.

Graphic accompanying the article: A five to seven year BESS requirement selects the founding cohort

How many customers can you really target?

Published 3 August 2026 · View on LinkedIn · Read the post

Last week I published a piece tracing the real ownership of fifteen of Britain's biggest consented solar and battery projects. The finding that traveled was the map, at least ten of the fifteen are not economically what their database entry says. This week I want to pull on the thread that matters most to anyone who sells into this industry, because the map has a commercial consequence folded inside it. If the projects have fewer ultimate owners than names, then suppliers have fewer customers than prospects. And almost nobody's sales plan reflects that. Read the full piece

Fifteen doors, ten buyers

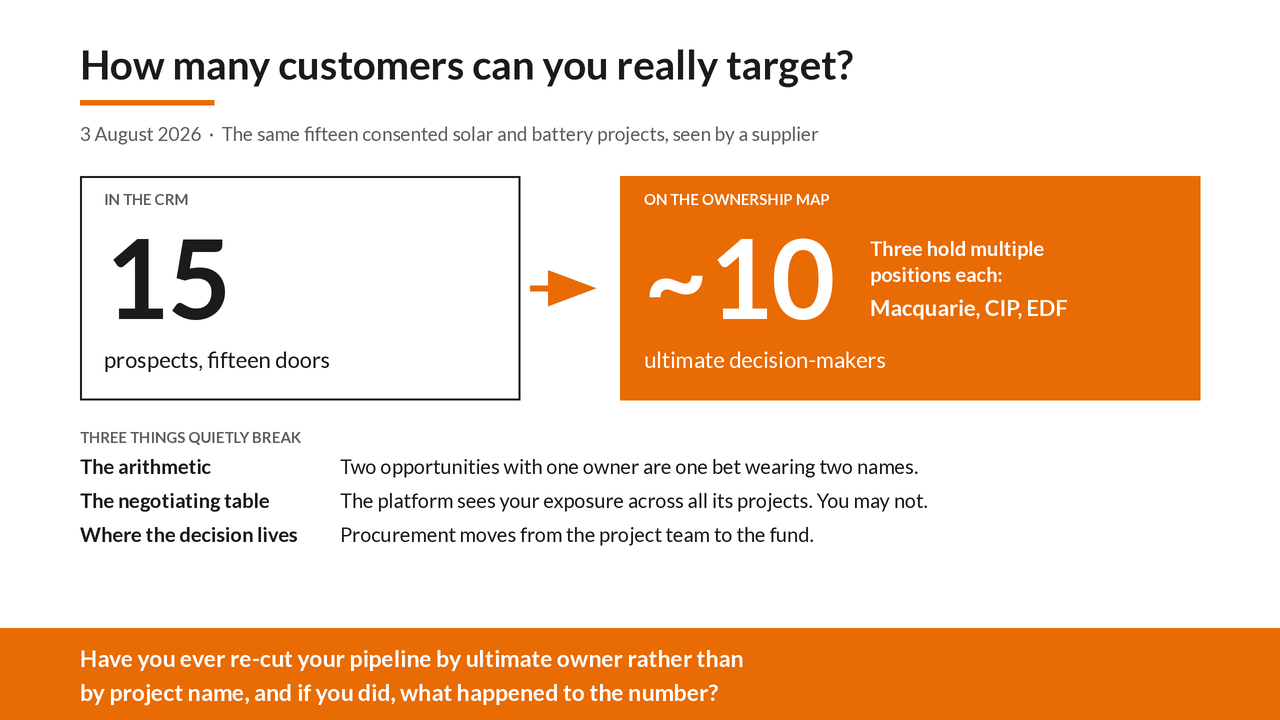
Picture a sales director building next year's plan. The CRM shows fifteen live prospects across the biggest consented projects in Britain. Fifteen relationships, fifteen probability weightings, fifteen doors to knock on. Now lay the ownership map over it. Those fifteen projects resolve to roughly ten ultimate decision-makers, and three of them, Macquarie, CIP and EDF, control multiple positions each. The prospect list is exactly the same length it was yesterday. The customer count is not.

Three things quietly break when that happens. The first is the arithmetic. Win probabilities assumed to be independent are not, two opportunities that share an ultimate owner are one bet wearing two names, and a pipeline weighted across fifteen doors is really spread across ten. The second is the negotiating table. When you price project A, a platform that also controls projects B and C knows your exposure across all three, and you may not even know they are the same buyer. That asymmetry is worth real margin and it runs entirely one way. The third is where the decision actually lives. Platforms do not buy project by project for long. Procurement moves from the project team, where relationship selling works, to the fund level, where scale and balance sheet win.

None of this is a forecast

I want to be clear about the status of the claim, because it is not a prediction. It has already happened, the reason it does not feel that way is that it happened below the visibility of the market maps everyone sells from. The platform deals of the last three years, EQT and Statera, Brookfield and Banks, KKR and Zenobē, Macquarie and Island Green Power, CVC DIF and Low Carbon, BW and Penso Power, looked like separate deals. Viewed from the supply side they were one event, the customer base consolidating. The developer-to-owner pivots looked like strategy fashion, they are what happens when consented projects become the asset the platform keeps rather than sells. And the thing mid-tier sales teams have been feeling for two years, cycles lengthening, decision rights drifting upward, good project relationships that suddenly cannot close project deals, is exactly what centralised procurement feels like from the outside when you cannot see the platform.

Other industries have made this exact journey

And it is well studied. When British grocery retail concentrated, supplier terms tightened until the state had to step in, a statutory code of practice in 2010 and a dedicated regulator, the Groceries Code Adjudicator, in 2013, both flowing from the Competition Commission's 2008 finding that the largest retailers were transferring excessive risk and unexpected cost onto their direct suppliers. The economists watching that market named the crueller mechanism underneath, the waterbed effect, better terms for the most powerful buyers worsening the terms for everyone smaller. I should say the evidence stayed contested, the Commission looked for the waterbed and declined to rely on it. It is still exactly the mechanism a mid-sized supplier should watch for, not least because by the time such things are provable they have already happened.

When car making consolidated, the supply base did not simply shrink to match, it restructured into tiers, a handful of system integrators holding the direct relationships and everyone else selling to suppliers rather than to the customer. Construction, my own former industry, shows the procurement endpoint, framework agreements as the default interface once buyers reach sufficient scale.

The early instruments are already visible in this market. Sungrow, the Chinese battery giant, has supplied BW's storage platform across its Swedish portfolio, then its Bramley project, then a single 1.4GWh order for Hams Hall, signed jointly with Penso Power a month before BW absorbed the company outright. The relationship travels with the platform, not the project. The same supplier holds the battery contract for Fidra's Thorpe Marsh and, as of financial close on 17 July, for West Burton C too, the two largest storage positions in the country, which makes a second platform relationship. Macquarie's pivot of Island Green Power from seller of projects to keeper of them converts a fifteen gigawatt pipeline into one owner's procurement function. CIP procures at fund scale across vintages. Offshore wind, one maturity step ahead of solar and storage, treats multi-project preferred-supplier arrangements as normal practice. And lenders' approved-vendor lists already do quietly what frameworks do formally, they gatekeep who is allowed to sell at all.

There are forces pushing the other way, and honesty requires them. Battery technology moves faster than framework terms, which favours spot buying. EPC wraps put a contractor between supplier and owner on many projects. And owners burned by price volatility are wary of long commitments. So the defensible claim is not that frameworks arrive tomorrow. It is that every industry whose customer base concentrated this way ended up there, the first instruments are already on the table, and a supplier's strategy should price that trajectory now rather than discover it in a lost tender.

Good news, bad news, unevenly distributed

Is concentration good or bad for suppliers? Both, and not evenly. The credit is better, a project company standing behind a Macquarie platform beats one standing behind hope. But the benefit has to be claimed, you are still contracting with a ring-fenced project company unless you negotiate the parent guarantee, what the ownership map changes is that you now know whom to ask and what their covenant is worth. The pipeline is realer, platform-held consents actually get built. Against that, the targetable market is smaller than the addressable market, the tier system rewards scale, and if the waterbed mechanism operates here, the squeeze lands hardest on the middle.

Who already knows all of this? The largest suppliers, though notice how they learned it, the expensive way, account by account, across years of deals, and notice too, on the evidence above, that the most platform-fluent of them are the largest Chinese manufacturers. Their knowledge is private relationship capital, their own buyer map, not the market’s. Who does not know it is almost everyone else. Mid-sized UK suppliers watching win rates decay without an explanation. New-technology entrants counting prospects that are really one buyer. And overseas entrants building a UK go-to-market plan from databases that still show a fragmented market which no longer exists.

So the question I would put to anyone running revenue in this supply chain is not how many customers you have. It is how many you can really target, who actually holds the decision for each of them, and whether your plan was built on the number of doors or the number of buyers. If you have re-cut a pipeline on ultimate ownership and found something different from your CRM, I would genuinely like to hear about it.

Follows “Who actually owns Britain’s energy transition?” (27 July). Ownership chains traced through Companies House filings, corporate statements and announced transactions, July 2026. Corrections welcome.

Graphic accompanying the article: How many customers can you really target?

Who actually owns Britain's energy transition?

Published 27 July 2026 · View on LinkedIn · Read the post

A few weeks ago I wrote that a grid connection is no longer a waiting list, it is a market structure. The post did well, and one question kept nagging at me afterwards. If grid positions and planning consents are now scarce, valuable assets, someone should be accumulating them. So why does every industry database still show a fragmented market of dozens of independent developers? Read the full piece

Correction, 10 August 2026: a claim made in this series about fund ownership across renewables and data centres was withdrawn. See Your biggest customer might have changed ownership twice.

I think I found the answer, and it is hiding in plain sight. The databases are not measuring the thing that matters.

The problem with counting developers

Almost every large renewable energy project in Britain is owned by its own dedicated company, set up for that single project. There are good reasons for this, it makes the project easier to finance and easier to sell. But it has a side effect. When a project changes hands, the company changes hands with it, and the project's name in every database stays exactly the same. The “developer” field never updates. You can buy half the pipeline in Britain and the market will still look fragmented on paper.

That was actually the thought that started all this, out in the garden. If concentration is coming to this market, I had been assuming it would arrive the way it does elsewhere, developers buying developers, the kind of deal that makes the trade press. But it does not need to. The projects are the companies. So the market can concentrate one project at a time, quietly, through purchases that never touch the developer's name, and the number everyone watches, the count of independent developers, need not move at all. Once that occurred to me I rather needed to know whether it was already happening.

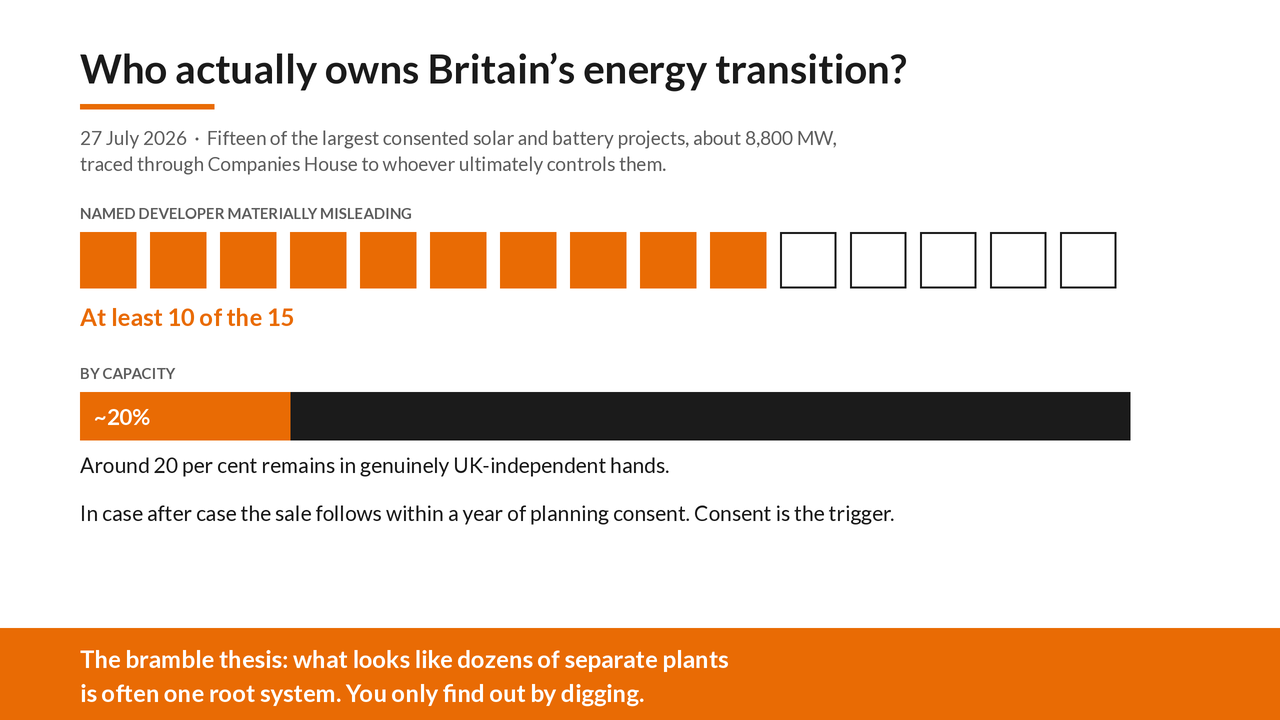
So I did the tedious thing. I took fifteen of the largest consented or under-construction solar and battery projects in Great Britain, roughly 8,800MW between them, and traced each one through Companies House to whoever ultimately controls it. Not the name on the planning application, the actual end of the ownership chain.

Standing in the garden it occurred to me that the market looks like a bramble patch, dozens of apparently separate stems. Brambles, though, spread underground, what looks like many plants is often one root system. The only way to know is to dig. So I dug. I have started calling it the bramble thesis.

What the chains show

Take the largest battery project in the country, the 1,450MW Thorpe Marsh scheme in Doncaster. The databases say Fidra Energy, a Scottish storage company. Walk the ownership chain and it runs through three group companies to a structure sponsored by an American energy private equity house in Washington DC, which has been there since the company was incorporated, the group's own corporate statements confirm it. And there is a twist. The UK's National Wealth Fund has taken a significant minority stake, which means the British state is a minority investor in the country's biggest battery project, inside a structure it does not control. Nothing improper about any of it, but “Scottish battery firm” is not the economic reality.

Or take the quiet accumulation nobody has named. EDF, the French state utility, bought the consented 500MW Gate Burton solar project outright a year after it won consent, holds half of the 800MW Springwell project, and has three more giant solar schemes behind them, one already consented and two moving through the system. Each transaction was announced separately. Put them together and EDF is arguably becoming the largest consolidator of big English solar, and I have not seen that sentence written anywhere.

Or the pattern I found strangest of all. The Coalburn battery projects in Scotland, among the largest in Europe, are funded by a Danish infrastructure investor, which has already agreed to sell half of each one to French and Danish institutional money, with the handover happening the moment each project switches on. These assets will have changed hands twice by the time they enter commercial service. Ownership here is not a register, it is a conveyor.

The timing is the part I keep returning to. Macquarie completed its buyout of Island Green Power, the developer behind the Cottam and West Burton mega-projects, months after both consents landed, then switched the company's whole strategy from selling projects to keeping them. The East Yorkshire solar farm was sold, as a company, nine months after its consent. Half of the One Earth project changed hands while the application was still awaiting its decision. In case after case the corporate event follows the consent event. Consent is the trigger.

The actual numbers

Across the fifteen projects, my figures, now checked link by link (the limits below still apply):

The named developer is materially misleading for at least ten of the fifteen. By capacity, around 20 percent of these 8,800MW remains in genuinely UK-independent economic hands, and I can name every megawatt of it. The rest terminates in Washington, Stockholm, Copenhagen, Paris, Sydney and Singapore.

And the counter-examples matter, so here they are. Ecotricity's 500MW Heckington Fen project is exactly what it says it is, a UK company that consented its own project and is building it. So is the Sunnica joint venture, and RWE's Pembroke battery is transparently on a listed utility's balance sheet. Interestingly, the projects that are what they appear to be cluster at the smaller end of my fifteen. The bigger the asset, the more likely the label is wrong.

One more finding I did not expect. In early 2024, when the InterGen gas power station business changed hands, the deal specifically excluded InterGen's consented 450MW battery project at Gateway in Essex, along with its pipeline of Scottish battery schemes. Those were kept back by the selling group and now sit in a separate company, and Spanish capital has since bought into the Scottish ones. A consented battery position was carved out of the sale of the entire business around it. The market is telling you, in transaction structure, that these positions are now a separate asset class.

I should be straight about the limits. The public ownership register only captures stakes above 25 percent, contractual control (framework agreements, forward funding) is invisible to it, and a couple of my chains end at structures I could not resolve from public records at all. So my concentration figure is a floor, not a ceiling. The real number is higher.

I would add one thing. Along the way I found four errors in the industry's own visible data, including three “developers” who had already sold up. That was one weekend of methodical checking. Which makes me wonder what a proper job would find.

Why would anyone hide this? Mostly, they aren't

I want to be careful here, because the tempting conclusion is the wrong one. Nobody designed these structures to hide ownership. Project companies exist because they make projects financeable and sellable, the opacity is a side effect, not a strategy.

Everything I found is on the public register, nothing was hidden from me. It is like hiding a key in a bunch of keys, to find it you have to know to look for it. The register is transparent, it just is not legible, and those turn out to be very different things.

But a side effect can still pay out, and this one pays out very unevenly. The professionals on the capital side are not confused by any of this, they trace these chains as a matter of routine, it is priced into every deal. The people who cannot realistically trace them are everyone else. The council weighing a planning application from a company with a local-sounding name. The policymaker designing support schemes on the assumption of a diverse, competitive developer market. The landowner negotiating an option without knowing the same fund holds the option next door. Nobody built that information wall deliberately. It is just that everyone on one side of it does rather well out of it standing.

And this is not a renewables story, it is a pattern with form. After 2008, American institutions bought hundreds of thousands of family homes through one-company-per-house structures, and for years the market looked like thousands of small landlords until researchers joined the companies up. Closer to home, investigations into English fishing quota found a handful of families controlling a dominant share through what looked like many independent vessel companies. In both cases the official picture stayed fragmented long after the reality had concentrated, because the measurement layer was pointed at the wrong thing. I would gently suggest we are watching the same film again, in a sector we are betting the country's energy security on.

And in energy itself, half of this count has already been done. Common Wealth put overseas ownership of British offshore wind capacity above eighty percent a few years ago, and that finding travelled widely. What has not been mapped is the consented onshore pipeline, where the ownership moves after consent, one project company at a time, below the visibility of every database. That is the gap this weekend was about.

So the question I would rather ask is this. If the ownership map matters for consent decisions, for policy design, and for anyone selling into this market, and if right now that map effectively exists only inside the institutions doing the buying, who should be responsible for making it visible? Because at the moment the answer is nobody, and that suited everyone fine until someone spent a weekend in the garden checking.

Method note: ownership chains traced through Companies House filings (persons with significant control, filing histories and charges registers), cross-checked against planning records, corporate statements and announced transactions, July 2026. Corrections welcome, genuinely, this is exactly the kind of work that improves with more eyes.

Graphic accompanying the article: Who actually owns Britain's energy transition?

Five predictions about UK energy

Published 14 June 2026 · Six posts, 14 to 19 June 2026

Five predictions about UK energy this week, one a day, and I'll mark my own homework on every one in the autumn. Read the full piece

Published as six posts, 14 to 19 June 2026. Text as posted, one typo corrected. To be scored in public in the autumn.

Sunday 14 June: the five questions

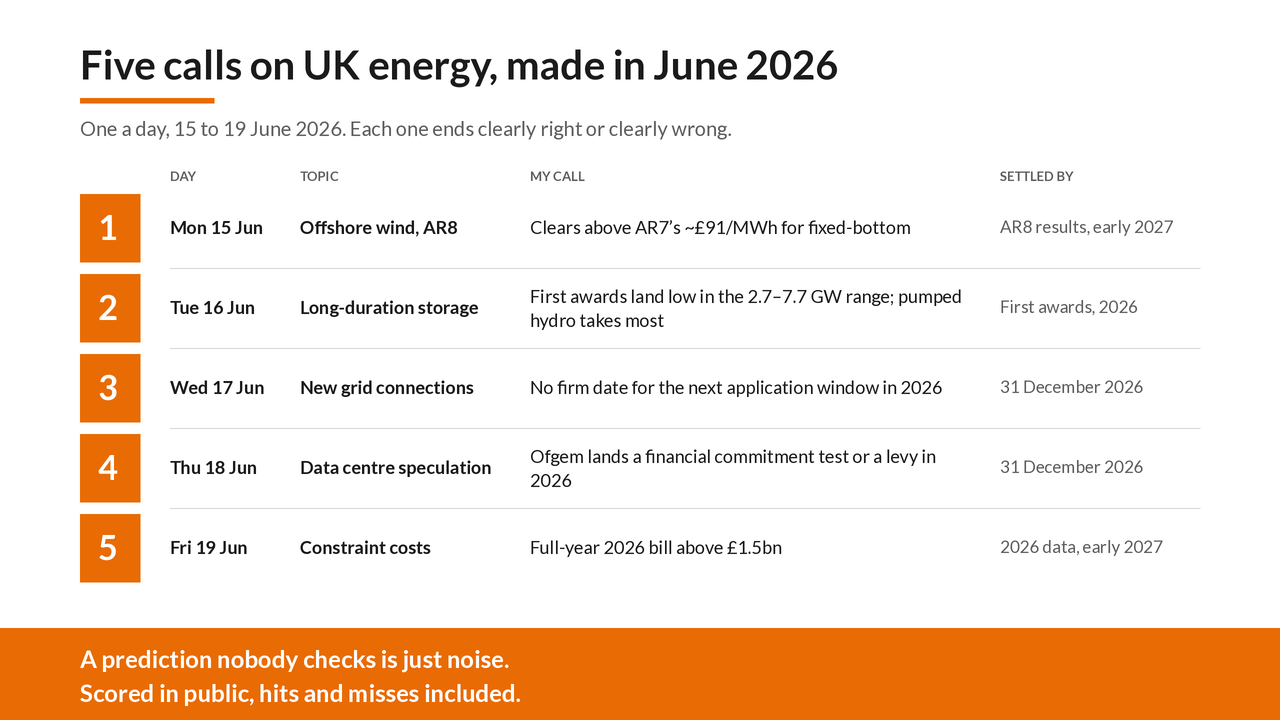
Most energy commentary describes what already happened. That's useful, but it's safe. So this week I'm doing something a little more exposed: five specific, dated calls on where the UK system goes next, posted one a day from Monday. No hedging, no 'it depends'. Each is the kind of claim that ends up clearly right or clearly wrong, and before long we'll know which. It's also important to point out that these are my own opinions, there's no connection to ENWCML my current employer.

Note added 27 September 2026: accurate when posted in June 2026. ENWCML is now my most recent role; see the Profile.

Here's the running order, as questions for now:

Monday: do offshore wind strike prices finally turn back up in AR8?

Tuesday: how large are the first long-duration storage awards, and who wins them?

Wednesday: does the door for new grid connections reopen this year?

Thursday: will Ofgem put a real price on data-centre speculation?

Friday: how big does the 2026 constraint bill actually get?

I have a firm answer to each, and a few of them cut against the consensus. I'll also come back in the autumn and score myself honestly, hits and misses included, because a prediction nobody ever checks is just noise.

Before I start posting, I'm curious where you'd bet against me. Which of the five do you reckon I'm most likely to get wrong? Call it now, and we'll see who reads this right.

Monday 15 June: My first call for the second half of 2026: offshore wind gets more expensive, not less.

This week I'm putting down five dated predictions for where UK energy goes next. Here is the first, and it cuts against the prevailing mood.

AR8, the next CfD auction, opens in July. Most commentary assumes strike prices keep drifting down, because that has been the direction of travel and because more competition is meant to push costs lower. I think that run is over. My call is that offshore wind in AR8 clears above where it landed in AR7, which was around £91 per MWh for fixed-bottom projects.

The reason is that the forces pushing prices down have largely run their course, while the ones pushing them up have not. Turbine and cable costs, financing rates and supply-chain tightness are all still elevated, and developers have spent two years saying the economics no longer work at the old numbers. AR7 already cleared below its administrative strike price, which suggests the headroom for further falls is thin. A government keen on volume, and AR8 was deliberately brought forward to keep volume moving, tends to get that volume by paying for it rather than by squeezing harder.

What would prove me wrong: a large budget paired with a low price cap that forces bidders down, or a clearing price held flat by sheer competition among offshore developers. Both are possible. We will know when the results land early next year.

So here's the question for the offshore people in particular. Am I reading the cost pressure correctly, or is there more room to fall than I'm giving credit for? Tell me where this call is weak.

Tuesday 16 June: Call two of five: the first long-duration storage awards land small, and pumped hydro wins.

My second prediction for the second half of the year, and this one resolves fast, possibly within days of this post.

Ofgem is about to make the first awards under the long-duration storage cap and floor regime. The indicative range it set was wide, 2.7 to 7.7GW of capacity. My call is that the first window comes in toward the bottom of that range rather than the top, and that large pumped-storage hydro takes the bulk of it, ahead of lithium-ion.

Two things point that way. Ofgem has said openly it will weigh technology diversity and may set aside some battery projects in favour of pumped storage or flow, which is a clear signal about where it wants the money to go. And the eligible pool is dominated at the top end by a handful of very large hydro schemes, the likes of Coire Glas at 1.45GW and Earba at 1.8GW, where a single award moves the whole number. A regulator running a brand new scheme tends to start cautious, prove the model, and scale later, rather than commit the full range on day one.

Where I could be wrong: Ofgem might decide the Clean Power timeline demands volume now and award nearer the top, or lean into batteries for speed of delivery. Both are live possibilities.

A note for anyone reading this after the fact, since the list may already be out: if it is, you can mark this one straight away, which is rather the point of making it.

For the storage people, what's your read? Does Ofgem go cautious and hydro-heavy, or surprise everyone on volume?

Wednesday 17 June: Call three: the door for new grid connections stays shut for the rest of 2026.

Halfway through the week, and a prediction I'd put real money on.

The connections reform reopened the queue for projects already in it, and offers are flowing again, area by area. But the route in for anyone new runs through the next application window, and NESO has quietly removed the date it once attached to that window. There is no longer even a 'no earlier than' marker. My call is that this does not change before the end of 2026. No firm opening date gets announced this year.

The basis is partly that the machinery is fully occupied. NESO is working through Gate 2 offers in tranches that run into early 2027, and you cannot easily reopen the front door while still processing everyone already inside. Partly it's that there's no obvious pressure forcing a date, since the projects that matter politically are mostly the ones already in the queue. New entrants are the constituency with the least leverage, and they're the ones left waiting.

What would falsify this: a government push to show the queue is open for fresh investment, perhaps tied to data centres or to a Clean Power progress story, could put a date on the calendar before December. It's possible. I just don't see the forcing function yet.

This one matters most if you're trying to get into the queue rather than through it. If that's you, I'd genuinely like to hear it. How are you planning around a window with no opening date?

Thursday 18 June: Call four: Ofgem puts a hard price on data-centre speculation this year.

Fourth of five. This one is about the demand side, which gets far less attention than generation but is where the next fight is.

The connection queue has been swamped by data centre requests, something like 50GW of them, more than the country's entire peak demand, and much of it speculative. Ofgem has been consulting on what to do, and has floated tougher financial tests, self-build, and a possible levy aimed squarely at filtering out projects with no real intention of being built. My call is that it goes beyond guidance and lands something with teeth this year: a financial commitment test or a levy that makes parking a speculative request genuinely expensive.

The logic is that soft measures won't shift behaviour when the prize, a connection in a constrained system, is this valuable. Guidance asks nicely. A levy or a forfeitable deposit changes the maths. Ofgem has signalled a further consultation for the summer, and the language in its recent output has hardened noticeably.

Where this could miss: regulators often consult, soften under industry pressure, and land something more modest than the early signals suggest. That pattern is real, and it's the main risk to the call.

Here's a question worth throwing open, because reasonable people land on different sides of it. Is pricing out speculation the right tool, or does it just hand the grid to whoever has the deepest pockets, the hyperscalers, and squeeze out everyone smaller? I lean towards it being necessary, but I can see the objection clearly. Where do you sit?

Friday 19 June: Call five: the 2026 constraint bill blows past anything we've seen, and I'll mark it at £1.5bn-plus.

Last of the five, and the one where I'm most confident about the direction and least confident about the exact number. So I'll say that plainly rather than dress it up.

Constraint payments are what we pay to switch generators off when the grid can't move their power, and then pay other plant to run in their place. In 2025 they had already passed £690m partway through the year, up sharply on the year before. NESO itself has warned the figure could reach £7bn by the end of the decade if the network doesn't catch up in time. My call is that the full-year 2026 number comes in well above 2025, and I'll put a marker down at more than £1.5bn for the year.

The direction isn't really in doubt. More renewables keep connecting in places the network can't yet fully evacuate, and the wires lag the generation by years. Every quarter the build programme runs late, the constraint meter runs faster. That part I'm confident about.

The precise figure is another matter. Constraint costs are volatile, weather-dependent, and sensitive to a few big network outages, so £1.5bn is a marker rather than a forecast I'd defend to the decimal. I'd rather name a number and risk being visibly wrong than hide behind a vague 'it will rise'.

So tell me if the marker is too bold or too timid. If you model this for a living, where would you put the 2026 total? And that's the five for the week, I'll come back and score myself on all of them in the autumn.

Five calls on UK energy, made in June 2026: offshore wind in AR8, long-duration storage awards, the next connections window, a price on data centre speculation, and the 2026 constraint bill